Working with Sysinternal tools -1
Windows Sysinternals: Documentation, downloads and additional resources provides a set of tools to get information about various functionalities on the system. The area of information include , process running on the system, file operations, registry operations, TCP/IP related tasks, security etc. The complete list of the tools available can be found here, Sysinternals Utilities. Though there are separate web-pages to view the introduction of each tool and download the tool, there is a dedicated page to download all the tool at once, Sysinternals Suite .
Sysintenals Live, Sysinternals Live is a service that enables you to execute Sysinternals tools directly from the Web without hunting for and manually downloading them. Simply enter a tool’s Sysinternals Live path into Windows Explorer or a command prompt as https://live.sysinternals.com/\<toolname> or \\live.sysinternals.com\tools\<toolname>.
You can view the entire Sysinternals Live tools directory in a browser at https://live.sysinternals.com.
The tools available through sysinternals are very helpful in various troubleshooting scenarios, and I use some of them on daily basis. Here I will try to explain my understanding about the tool and How to I get a particular information through them. It is not possible to demonstrate all of them at once, so this blog-post will get updated over-time whenever I have something to add or edit to it.
Process Explorer
Process Explorer is similar to Windows Task Manager, but shows more information and has extra functionalities to display more information about a process. On display of all the running processes, rather than showing the list of processes, it shows them as tree structure. With tree structure, it is easy to identify which process is parent process and which is child process. For example, If you launch cmd.exe from Start->Run, you will see that the Explorer is the parent process of cmd.exe .
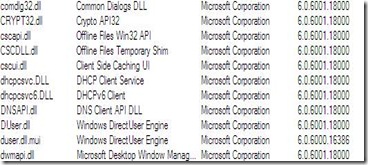
The other cool thing I like about Process Explorer is, it give the handle information, which are held by the process, with the type of the handle and which different dlls are loaded in the process address space and their path. It is very helpful in certain scenarios. The type of handle may be, File, Event, Mutex, Registry, Process etc etc.
How to view handles for a process?
View-> Lower Pane view->Handles , there will be a windows in lower half of the process explorer. Select a process from top windows, to view its handles.
It get refreshed frequently, when a handle is created or deleted, it displays with green or red color.
How to view Dlls loaded within a process?
View-> Lower Pane view->Dlls , there will be a windows in lower half of the process explorer. Select a process from top windows, to view its loaded dlls.
There is no 64bit version of process explorer, so how a downloaded version which is 32 bit binary can walkthrough the 64 bit process address space and list all the dlls? This is solved by process explorer by a trick. I would assume, When process explorer is launched on a 64bit machine as a 32 bit binary, it checks through it code if it is running on a 64bit machine. If yes, it launches a 64 bit binary from within a 32 bit binary. As below—
And procexp.exe has a handle to the process as well.
The 64 bit exe will get deleted when process explorer is closed.
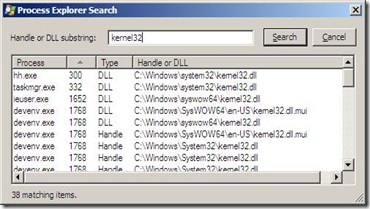
Search is a vast business today and an important feature for any product. Process Explorer has a search only for handles or dlls, in all the processes. Standard Ctrl+F will give below dialog. The Find feature has always saved a lot of time for me, to pin point the exact process, rather than search manually for each process.
Help file is available for Process Explorer.
TCPView
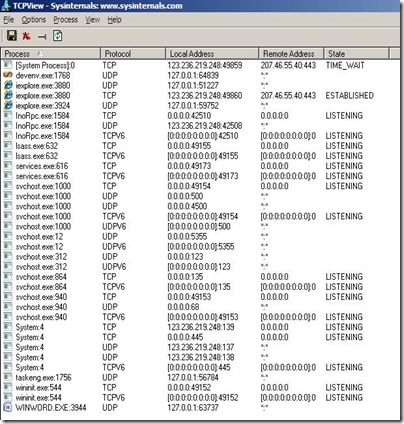
TCP View is another tool which I use frequently to troubleshoot issues with Network programming. Often, it is needed to know that which port has been used by which process and with protocol and who is at the other end. While the same can be retrieved by netstat , but TCP view provides this information in GUI format and with refreshing screens. It is easy to view the behavior of the connections with TCP View in their different states.
The IP Address can be resolved in machine names as well through options menu.
The same can be achieved by your own program as well using below APIs.
GetExtendedTcpTable Function (Windows) and GetExtendedUdpTable Function (Windows).
Help file is available for TCPView.
Process Monitor
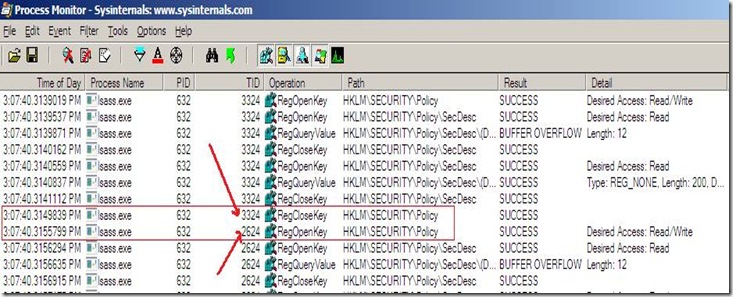
Process Monitor is another very popular tool which is widely used. Initially there were tools like Filemon and Regmon but later integrated as Process Monitor. Filemon was used for tracing file related operations and Regmon was used for registry related operations. Now, with Process monitor, we have file and registry related operation in one tool and added network and process related operations. As a simple example, if a file has been created, opened, read, write, close or delete on file system, process monitor can record all these activities and can show the details with time, process name, which operation, on which file, the result of the operation and the details of the operation. The same applies to the registry activity. The cool point is, it can show that which threadID of a process has actually performed this activity.
Using Filter menu, you can restrict your capture, all activities by a particular process, all activities on a particular file or all activities by a particular process on a particular file. It has a lot of filters that can be applied to capture only what we want. Generally I get the complete capture from customer’s site, get the files and then apply needed filters here. Applying the correct set of filters will exactly show you what you want to see in the capture. Network activity can also be monitored from send or receive protocol packets, but I generally used Network Monitor from Microsoft.
Help file is available for Process Monitor.
VMMap
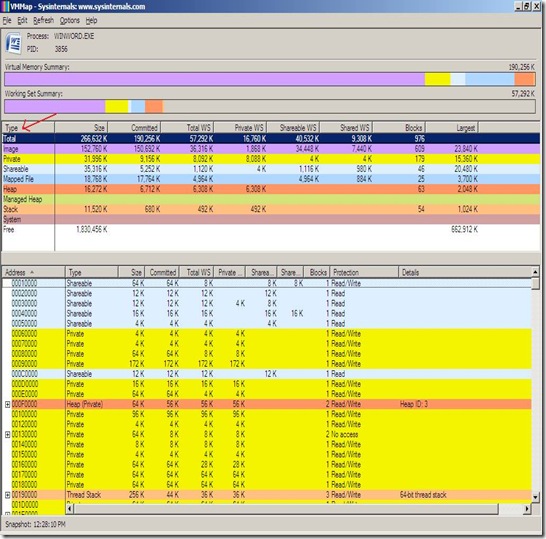
The other tool is VMMap. VMMap is for Virtual Memory Map. VMMap is used to walk through the virtual address space of the process when selected and gathers the information about which memory is used for which purpose, displays with addresses in different colors. VMMap is helpful to look inside the process, and track any changes.
By default it displays the “Total” virtual memory in the lower pane. If you want to see only the loaded images (dlls), then you can select the “Image” from the upper pane list and it will convert as below—
Help file is available for VMMap.
Nitin Dhawan
Windows SDK - Microsoft

