Azure IntelliTrace
Here is some great information on using IntelliTrace with Azure:
The key knowledge is:
IntelliTrace is specifically licensed in Visual Studio 2010 Ultimate (VS) as a Dev and Test tool for non-production environments.
When IntelliTrace is enabled, the Azure role instances do not automatically restart after a failure. This allows Windows Azure to persist the IntelliTrace data after the failure; Azure waits for a developer to download the data and manually restart the role instance.
IntelliTrace is implemented via IL rewriting, similar to a profiler.
Specific events are configured in the CollectionPlan.xml file located in C:\Program Files (x86)\Microsoft Visual Studio 10.0\Team Tools\TraceDebugger Tools\en. The file’s content controls which methods are rewritten along with how trace data is later displayed in the VS debugger. There isn't a supported way to add custom events.
Including the "call information" option basically rewrites all methods; there is a one-size-fits-all way to display the methods not present in the CollectionPlan.xml file.
The IL is rewritten when .NET loads the IL. This is so that the same bits can be deployed with or without IntelliTrace enabled.
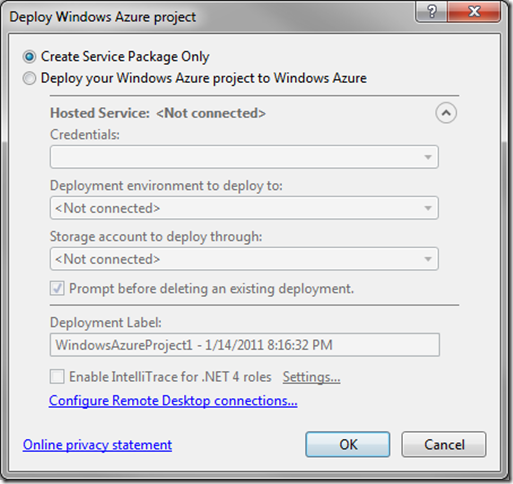
The "Enable IntelliTrace" check box is only enabled when deploying from VS. IntelliTrace is not supported when only creating a service package which Op's will later upload to Azure, notice check box is disabled:
IL rewriting adds calls to an API which logs the data through named pipes. Another process receives the data from the named pipe and writes it to local disk.
When a developer right clicks an instance in VS Server Explorer and selects “View IntelliTrace logs”, VS copies the trace data from the instance's local disk to an Azure Storage blob named “intelitrace” and then to the developer’s local disk. After the logs are on the developer's disk the copy in Azure Storage is automatically deleted.
In addition to viewing the data in VS there is an API for reading the data for custom tooling.
