Forecasting Sales data with Excel mining - Step by Step Guide
Mining is a service and can be coded. This means that it is enterprise ready. Mining can be done using
- Excel
- SSDT
- PowerShell and
- SSMS
Analysis Services service should be "ON" for mining to run
Using a combination of basic PowerPivot and Mining Plugins for Excel 2013, let us create a forecasting model.
- Open Excel 2013
- Click on PowerPivot Tab
- Click on Manage – Manage helps to import relevant data. A new window opens up
- Click on “From Database” and choose SQL Server
- Complete the data connection wizard
- Type in name of the server (Could be the same as name of your machine or localhost)
- Use Windows authentication or use SQL Server Authentication. Example: sa and pwd
- Connect to ContosoRetailDW and Test Connection
- Click Next to pick necessary tables. Choose the first radio option to select a set of tables
- Choose FactSales
- Select related tables (6 related dimension tables will be added)
- When you finish the wizard, data will be imported to PowerPivot i.e. memory
- Fact Sales has data for the year 2007, 2008 and 2009. Based on available memory choose a smaller dataset example: year 2009 only
- Click on Pivot Table and select flattened Pivot Table. A flattened Pivot table, removes sub-total
- Select Calendar Month on rows and SalesAmount on Columns
- A warning pops up asking you to create relationship between the tables
- Create relationship between Tables and columns of DimDate and FactSales as shown below
Create Count of Sales Amount and Average Sales amount
- Drag Sales amount to columns again
- Select Value field settings from the drop down
- Choose Count
- Repeat process a to c above to create average
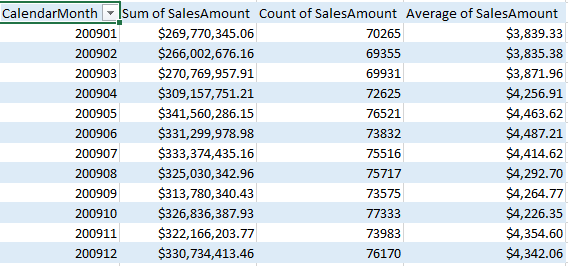
- Resultant Pivot table will be as below
- Select and paste as values (so that there are no formulae in the numbers)
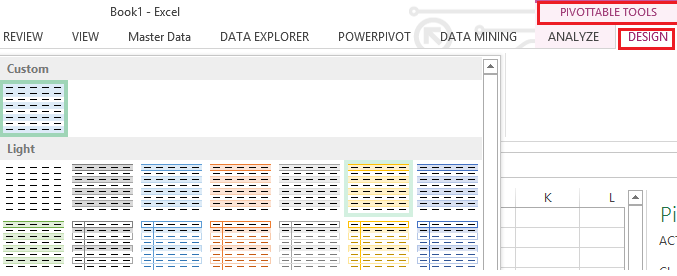
- Go to design and set selected data area as a table
- Click on the data mining tab
- With all cells with data selected, choose forecast from the ribbon
- Data range will be automatically selected
- Choose all columns for input i.e we use 3 variables here – Sum of sales, Count of sales and average sales
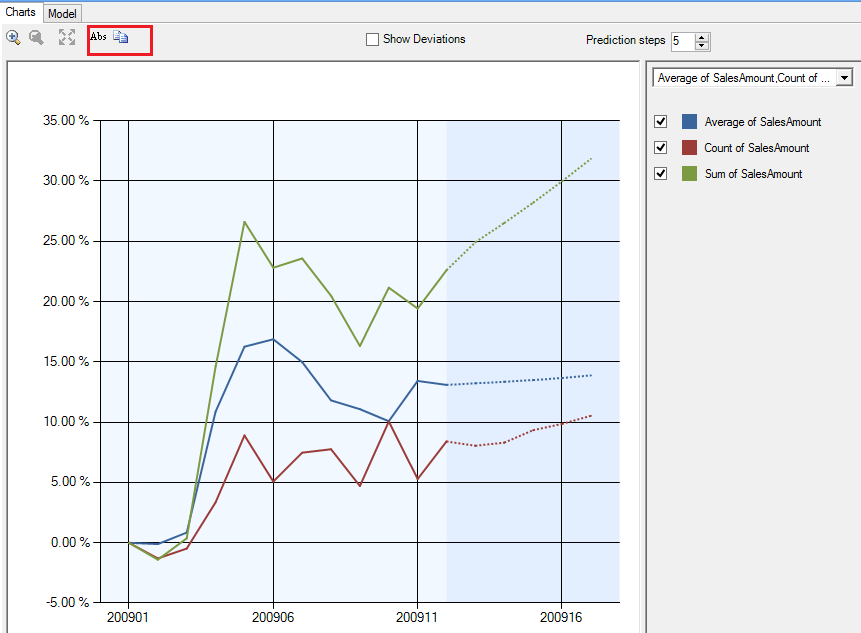
- A new chart pops up, where you can increase or decrease the number of prediction steps
- You can also toggle using Abs between absolute values and percentages.
- With percentages all 3 lines are visible clearly, where as with absolute the scale is such that only sales will be seen.
Count and Average when displayed on a chart with the same scale as sales amount will be almost invisible
-
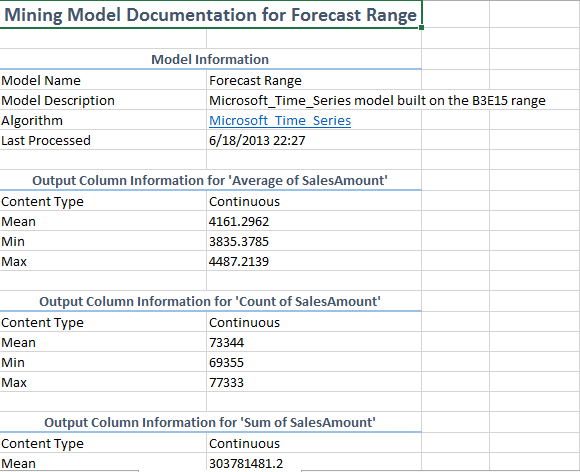
- Click on document model to see parameters used
- Click on Trace to see queries used
- ART xp is used for short term forecasting and ARIMA is used for long term forecasting
- Forecasted values use cross prediction ie predict based on all columns available as variants
- 65000 such parameters can be used in a model
Forecasting is used in medical field to trace temperature, Blood pressure and forecast for the future. It is used in mutual funds as an analyzer before investments are made.
Comments
Anonymous
June 25, 2013
Marvellous Explanation Deepthi. Thank youAnonymous
February 08, 2015
That mean we can also manke linked tables use it as powerpivot tables


