Enhancing TFS 2010 Dashboards – Project Mgmt, Bugs, Builds, etc.
As we build out our dashboard to show our progress on our software projects, we quickly enjoyed the luxury of the new TFS Dashboard views that utilize Windows Sharepoint Services (WSS) web part Page Viewer. This web part connects to a URL on the TFS application tier called tfsredirect.aspx that then will load a report from the report site. To summarize,
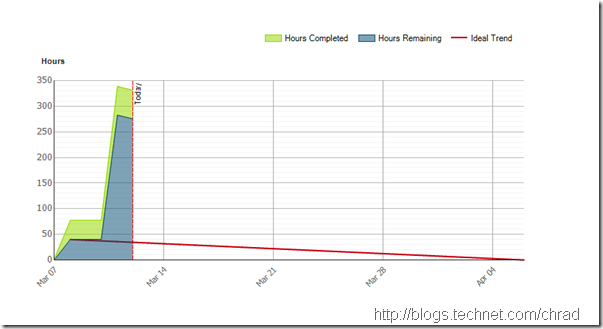
For the most part, I’m liking the dashboard and its default web parts – Burndown & Burn Rate. The users of Beta 2 quickly found out that by default this was broken and often shows an SRS error when hitting the project portal. This is easily correctable.
However, the point of today’s post is to share with the audience how to expand the power of the dashboard and share what I’ve learned in building a portal that helps my team stay on top of their projects.
SharePoint “Default” Collection Site vs. TFS Dashboards
In TFS 2010, everything starts at the collection level and fans out from there. All projects are now a member of some collection, such as DefaultCollection. By default, the root of the site collection is always hosted at the address https://tfsapptier/sites/[collectionname]. This represents the Site Collection for every project, and, based on permissions the Web part will show up in the list of projects on this site. A Site Collection administrator will see all projects, whereby project user would only see what they have rights to see.

As you can see, a Site Collection administrator sees everything while standard project users will see just Home and the projects they have permissions to access.
Enhancing your “Out of Box” Dashboards in TFS 2010
Anytime a user starts at the home they will see the default Site Collection site. However, when the user selects their individual project they are directed to that projects dashboard. The project dashboard is actually a specialized site located at the URL for each project, such as https://tfsapptier/sites/[collectionname]/[projectname]/dashboards/projectdashboards_wss.aspx. This page is where your typical dashboard on per project is located.
In our case, I wanted to have a centrally located place that any partner or team member could quickly see our progress in any sprint (We use SCRUM for our software development) so I started by re-doing the home page for the site collection. I did this re-work using Microsoft Office SharePoint Designer 2007 as I wanted to change the way the layout worked. I wasn’t the artist, though, and I give Bryan Allen credit for the pretty look and feel. What I did have to do is change the web part properties to go horizontal, not vertical so reports could sit side-by-side. This isn’t the design of the home page that you are looking at here - Instead, I didn’t want announcements or Calendar. Instead, I wanted a dashboard that would show real-time status for each of our software projects so that anyone could find out quickly how we are doing. I designed the page by removing the announcements & calendar web parts and then, using SharePoint Designer, adding horizontal rows (named First, Second, Third – unique, ay?) that could then house my various web parts to describe each project. Beyond that, I also utilized it to define the projects so that people would understand what they are in simple terms. After saving, here is what I have -
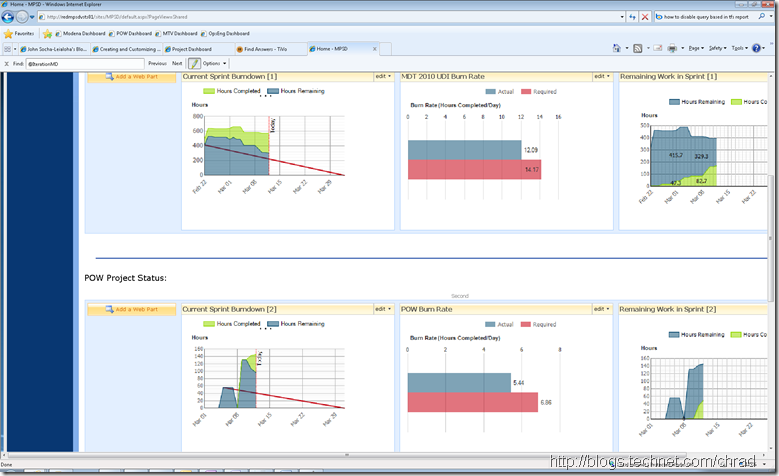 This is all “out of box” with TFS 2010. This required no custom code but just simply some changes to the home page utilizing SharePoint Designer. Let’s talk about how this was done…
Utilizing Web Parts from each Project
The first thing to note is how TFS 2010 in-box dashboards were created. If you go to any project in Visual Studio (or via your SRS link), you will notice that there is a Dashboards folder with two reports. The Burndown & Burn Rate are the built-in reports coming in TFS 2010 (unless we change this between RC1 and RTM which is doubtful). If you inspect the web parts closely in the project site, you will notice that they are using the Page Viewer Web Part and that they access a URL -
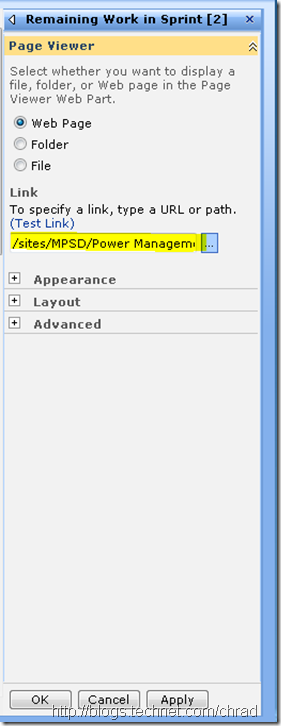
This will quickly get inspected to notice that it uses the following URL -
/sites/[collectionname]/[projectname]/TfsRedirect.aspx?tf:Type=Report&tf:ReportName=Project Management%2fRC2 Remaining Work&tf:ShowToolbar=0&Width=250pt&Height=180pt
The magic comes when you know that you can easily add any Web Page Viewer part and simply replace the following in each URL-
/sites/[collectionname]/[projectname]/TfsRedirect.aspx?tf:Type=Report&tf:ReportName=Project Management%2fRC2 Remaining Work&tf:ShowToolbar=0&Width=250pt&Height=180pt
If you replace this with Build, Bugs, Dashboard, or Tests and then the report name you will be in business. You now have you a highly valuable dashboard that allows management to get insight into the projects velocity and success all using out-of-box components.
IsDashboard Parameter
The first thing you will notice when you start adding reports from other folders, such as remaining work, is how they are displayed are much different. They show the report title and all the standard SRS report contains. This doesn’t make it nice when attempting to use in a Dashboard. The great TFS folks, though, in there mighty wisdom knew that folks such as me would come calling and demanding the ability to show these other valuable reports on the Dashboard. Enter the “InDashboard” parameter.
For each report outside of the dashboard, the schema supports a parameter called “IsDashboard” and it is a boolean. It is very easy to change this to True using your Report Manager and all of a sudden you have some nifty tools to make a highly effective dashboard.
Steps to change parameters for TFS 2010 report to be on a dashboard:
- Hit your Reports server by going to https://tfsapptierserver/reports
- Click on your project collection
- Click on the project where you are attempting edit (like project management)
- Click Show Details in the right hand top corner

- Click the edit button

- Click parameters
- Towards the bottom, you will see “IsDashboard” with a true/false selection
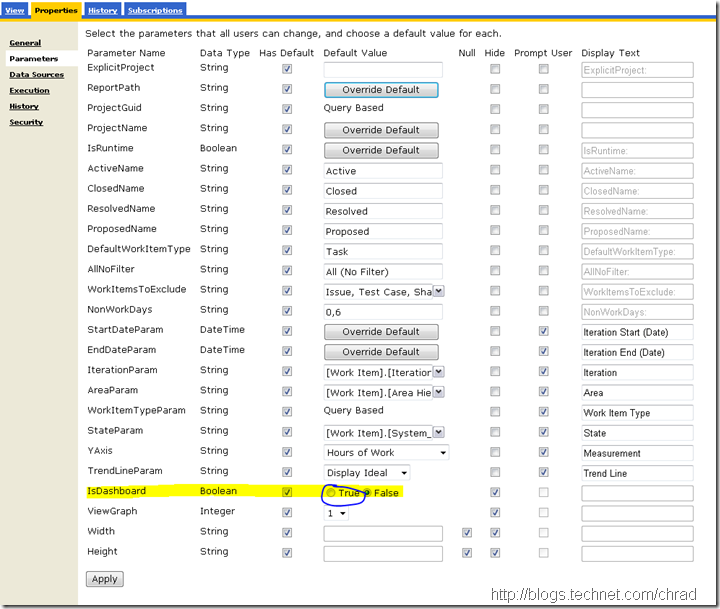
- Select True
- Click Apply
- Now run your report
Before: (with False)
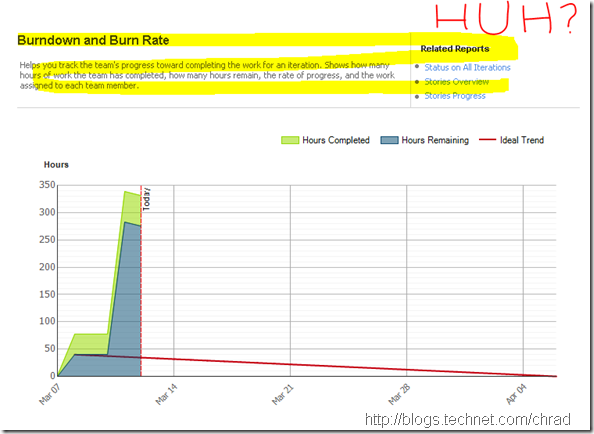
After: (with True)
Summary
In today’s post I focused on helping you evolve your TFS project dashboard by bringing together the various steps it takes to grab report data from the various projects. This makes it very handy as then users can hit a single location and see the status of your project and that leaves you more time to yell at developers and testers. <kidding>
Thanks,
-Chris
Comments
Anonymous
January 01, 2003
I have been trying to create a sharepoint dashboard using Scrum for Team System template instead of MSF Agile. Do you know if it is possible to customize Scrum for Team System reports to be shown in a Dashboard? There is no "IsDashboard" parameter when you edit report parameters. Thanks!! LuisAnonymous
January 01, 2003
Hey Joe- You can play with the query string parameters for height & width. This is how I went about doing it. I went to the one that was largest and came up with a value and then set it the same for all. Here is the query string - /sites/[collectionname]/[projectname]/TfsRedirect.aspx?tf:Type=Report&tf:ReportName=Project Management%2fRC2 Remaining Work&tf:ShowToolbar=0&Width=250pt&Height=180pt Width=250pt&Height=180pt ... This is currently 'point' so play with it until it goes away. Really technical, ay? Let me know if that doesn't work for you :) Thanks, -ChrisAnonymous
January 01, 2003
Hey Luis, I'm, unfortunately, not very familiar with SCRUM for Team System running on TFS 2010. Early on, I tested their v3 template and we decided to stick with the MSF Agile and just make the customizations. I'm unsure of any possible customizations of their reports and I hate to say this but I would have to refer you to EMC/Conchango. The IsDashboard parameter is created by the report authors, who in the MSF Agile case, was Microsoft and was done to ensure that the reports could show up on the Dashboard. Since EMC is the authors of their reports, they would need to author reports with a similar type of parameter to get this functionality. The last piece to know is that you could potentially learn more about using the Report Designer and you could potentially edit the report yourself to have a dashboard view. This has a rather steep learning curve though. FYI, there is a recently released SCRUM template for TFS that Microsoft made so you might investigate if this is something you could use. However, I know it is expensive to move off templates so it might not be an option. (blogs.msdn.com/.../a-scrum-process-template-for-tfs.aspx) Sorry for not being much help here... Thanks, -ChrisAnonymous
April 29, 2010
Very helpful, Chris. How did you get the "Remaining Hours" graph so small? I keep ending up with scrollbars when I try to get it down to a size I like. Thanks