Debug Node.js Web Apps on Azure
Azure provides built-in diagnostics to assist with debugging Node.js applications hosted in Azure App Service Web Apps. In this article, you will learn how to enable logging of stdout and stderr, display error information in the browser, and how to get heap and CPU profiles.
Diagnostics for Node.js applications hosted on Azure is provided by IISNode. While this article discusses the most common settings for gathering diagnostics information, it does not provide a complete reference for working with IISNode. For more information on working with IISNode, see the IISNode Readme on GitHub.
Finding Error Info:
If you are receiving a 500 error on your node.js webapp, Here are few things which you can try to get more info
1) Watch error info on web page (not recommended for production app)
Include below line of code in iisnode.yml file at webapp root folder(D:\home\site\wwwroot).
devErrorsEnabled: true
After including above line, restart your web app and You would start seeing something like below on web browser.
 iisnode encountered an error when processing the request.

 HRESULT: 0x6d
 HTTP status: 500
 HTTP subStatus: 1013
 HTTP reason: Internal Server Error
2) Using Failed request tracing in azure webapps
- Select your web app in Azure portal(https://ms.portal.azure.com/).
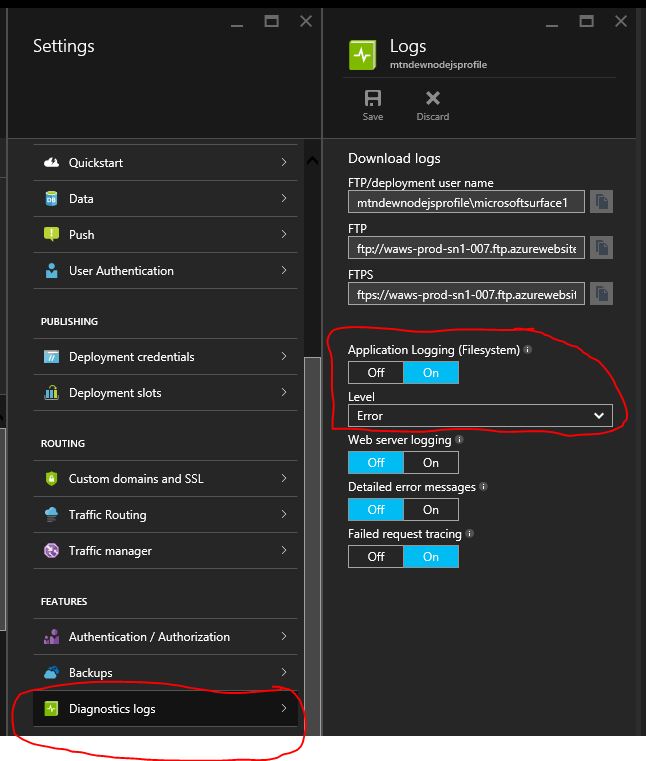
- Click on Diagnostic logs in webapp settings and Turn On Failed Request Tracing in Diagnostic Logs Tab.
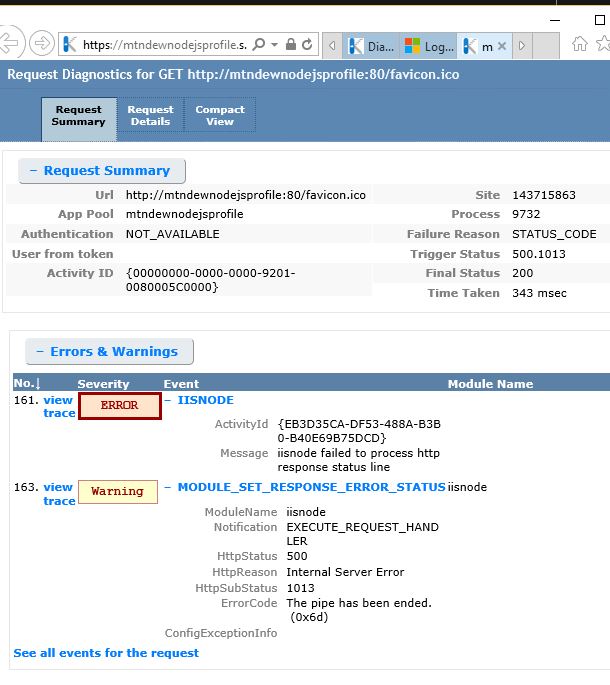
- After turning on Failed Request Tracing, Access your error page in browser. This would create new folders(W3SV****) containing failed request logs @ D:\home\LogFiles\ in kudu console(https://Your_Website_name.scm.azurewebsites.net/DebugConsole).
- Failed request logs would provide you more meaningful info about application error. Below is a sample screenshot
Useful Logs :
To Troubleshoot above issue, below logs may help you
- Uncaught Exception: All uncaught exceptions are by default written to logging-errors.txt file in D:\home\LogFiles\Application folder. You can view them using kudu console(https://Your_Webapp_name.scm.azurewebsites.net/DebugConsole).
- stdout and stderror:
stdout : console.log("log content") - log content would be visible in XXX-stdout-xxx.txt file @ D:\home\LogFiles\Application folder
stderror: console.error("error content") - error content would be visible in XXX-stderr-xxx.txt file @ D:\home\LogFiles\Application folder
You can turn-on these stdout and stderr using below two ways
1) Using iisnode.yml file : Include below line of code in iisnode.yml file at webapp root folder(D:\home\site\wwwroot).
loggingEnabled: true
2) Using Azure Portal :
- Select your web app in Azure portal(https://ms.portal.azure.com/).
- Click on Diagnostic logs in settings option and Turn On Application logging in Diagnostic Logs Tab.
Remote debug :
Below content explains how to remotely debug your Node.js application deployed on Azure Web Apps using the node-inspector debugger.
1) Enter below line of code in iisnode.yml file at webapp root folder(D:\home\site\wwwroot).
debuggingEnabled: true
2) Check if your web.config file has below rule, else Include it.
 <rule name="NodeInspector" patternSyntax="ECMAScript" stopProcessing="true">
 <match url="^server.js\/debug[\/]?" />
</rule>
3) Navigate to https://yourapp.azurewebsites.net/server.js/debug . This should bring up the familiar node-inspector interface for your application, which allows you to set breakpoints, inspect code, etc
For Advanced configuration on using custom debug url, please refer https://tomasz.janczuk.org/2013/07/debug-nodejs-applications-in-windows.html
More Debug Info:
1) Enter below line of code in iisnode.yml file at webapp root folder(D:\home\site\wwwroot) .
debugHeaderEnabled: true
After making above change you would see a url in each response header as in below screen shot. It would provide us insights into state of node.js application.
Please find more details @ https://tomasz.janczuk.org/2012/11/diagnose-nodejs-apps-hosted-in-iis-with.html


