StreamInsight has a very powerful management service that is fully available to developers and administrators alike. Any technique that you see in the Event Flow Debugger or in the API can be remotely invoked via the Management Service. This enables all sorts of tasks and scenarios, such as remotely deploying queries to a live server, querying the memory used by a live query, or capturing event traces to diagnose query correctness issues.
In this blog I’ll explore some of the “getting started” techniques for successfully connecting to the management service for diagnostic and debugging tasks, and show some tips and techniques I’ve picked up along the way:
- Successfully connecting to the management service (required to use the Event Flow Debugger against a live system)
- Querying the diagnostic views
Getting Started
All of the StreamInsight API’s are available either in process (in the case of the embedded server model), or via the management service (in case of the remote server model). To think about this from a code perspective:
| Embedded Server | Remote Server |
|
|
In both cases the Server object is the same from a functional perspective - under the hood it’s a lot different (as the remote server usage calls the management service over the wire), but virtually all of the same calls, API usage, all work without any other modification. Regardless of whether you run embedded or remote, being able to connect diagnostic tools (such as the EventFlowDebugger or a PowerShell script) is crucial in understanding and evaluating the performance and stability of a running system.
In the case of the standard StreamInsight service that ships with V1, the management service is already exposed via the URL https://localhost/StreamInsight/Default. For deployments using an embedded server, you’ll need to expose the management service yourself before leveraging any of the tools or techniques in this blog post. Luckily, that’s a straightforward process.
Exposing the Management Service for an Embedded Server
The management service is exposed as a standard WCF service endpoint. Making that service available to consumers involves a few steps:
- Creating and hosting instance of the StreamInsight management service.
- Enabling the StreamInsight host to expose the requested HTTP endpoint.
- Adding the user accounts to the appropriate StreamInsight group.
- Verifying that the service endpoint is available.
A full discussion of this topic is given in the StreamInsight documentation, under Publishing and Connecting to the StreamInsight Server.
Creating and hosting an instance of the StreamInsight management service
This is about as boilerplate as it comes. This is the standard utility function that I use for registering and hosting the management service endpoint.
Code Snippet
- try
- {
- RegisterManagementService(cepServer,
- "https://localhost:8080/TelemetryService");
- }
- catch (Exception ex0)
- {
- trace.LogException(ex0, "Error in exposing management service");
- }
- private void RegisterManagementService(Server cepServer,
- string hostUrl)
- {
- /////////////////////////////////////////////////////////
- // Register the management service
- var service = cepServer.CreateManagementService();
- cepManagementHost = new ServiceHost(service);
- cepManagementHost.AddServiceEndpoint(
- typeof(IManagementService),
- new WSHttpBinding(SecurityMode.Message),
- hostUrl);
- cepManagementHost.Open();
- trace.LogInformation("Opened management service at URL " + hostUrl);
- }
What this code does is, given a Server object and a URL, creates and hosts a management service using the default security model. The trace object is an instance of the StreamInsightLog object that I wrote about in this blog post, as a generic wrapper around log4net. If you get an exception here, it’s usually a security or configuration issue. The next two steps refer to the most common configuration/security problems.
Enabling the StreamInsight host to expose the requested HTTP endpoint
In Windows 7 and Server 2008, processes need to be given explicit permission to bind/expose HTTP endpoints. If upon attempting to expose the management service, you receive an error message along the lines of:
|
You’ll need to configure your machine with the requisite permission (remember that this command needs to be executed from a command prompt with elevated privledges):
|
Replacing the url (including port number) and user account with your account information (including service account if your application runs as a service).
For more information on this topic, including configuring for remote connections and XP/2003 machines, see Publishing and Connecting to the StreamInsight Server.
Adding the user accounts to the appropriate StreamInsight group
By default, any user that wants to connect to the management service needs to belong to the StreamInsightUsers$[Instance Name] group, typically the StreamInsightUsers$Default group. For more information on this group, see the StreamInsight Users Group section in the Installation (StreamInsight) section.
To add a new user account to the group:
|
Here’s the part I always forget – your group membership is cached at login, so you’ll need to log out and log back in again.
To confirm that your group membership is updated:
|
Verifying that the service endpoint is available
We’ve created the service and exposed the endpoint, configured the appropriate network security, and added our user account to the right groups. The last step here is to ensure that we can connect to the endpoint. The easiest way to do this is simply start up the Event Flow Debugger, and connect to the service. The detailed documentation on using the debugger is Using the StreamInsight Event Flow Debugger. The quick steps are:
- Click the Start button, point to All Programs, click Microsoft StreamInsight 1.0, and then click StreamInsight Event Flow Debugger.
- In the debugger, click File and then click Connect to Server. Enter the server endpoint address (the URL we passed to the RegisterManagementService function above).
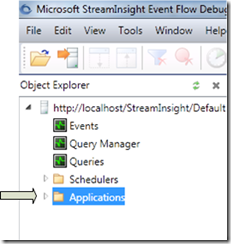
- From the Object Explorer, click on the expand button next to the Applications node.
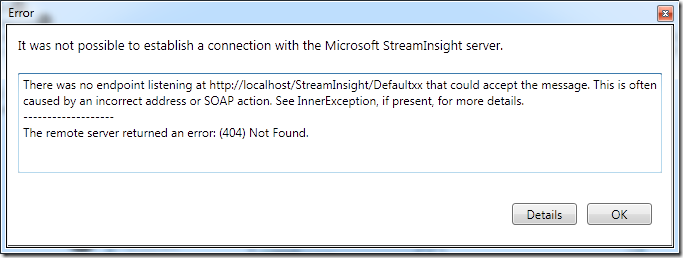
If the service endpoint is available, the debugger will display the list of applications available for that instance. If you receive the error “It is not possible to establish a connection with the Microsoft StreamInsight server”, click on the Details button to see the detailed error message.
In this case (There was no endpoint listening at https://localhost/StreamInsight/Defaultxx that could accept the message. This is often caused by an incorrect address or SOAP action. See InnerException, if present, for more details. The remote server returned an error: (404) Not Found), there’s one of two things that I missed:
- The service isn’t running (i.e. make sure your application is running, the RegisterManagementService function has executed and not thrown an exception))
- The URL is incorrect.
The endpoint not being active can also manifest as The HTTP service located at https://localhost/StreamInsight/Default is too busy. -------------------
The remote server returned an error: (503) Server Unavailable.
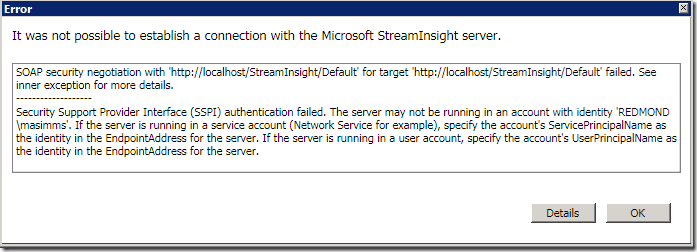
If you encounter the error, SOAP security negotiation with ' https://localhost/StreamInsight/Default' for target ' https://localhost/StreamInsight/Default' failed. See inner exception for more details, ensure that your user account is properly registered with the StreamInsightUsers$[Instance] group.
Some Basic Diagnostic Views
We’ll start by using the Event Flow Debugger to observe some basic diagnostic information, then flow over into some basic PowerShell scripts to look at the same information. My next blog post will cover some more advanced uses of PowerShell scripting against the management API to answer more advanced questions such as “which of my queries is consuming the most CPU”.
Let’s get started with the Event Flow Debugger;
Click the Start button, point to All Programs, click Microsoft StreamInsight 1.0, and then click StreamInsight Event Flow Debugger.
In the debugger, click File and then click Connect to Server. Enter the server endpoint address (the URL we passed to the RegisterManagementService function above).
From the Object Explorer, click on the expand button next to the Applications node.
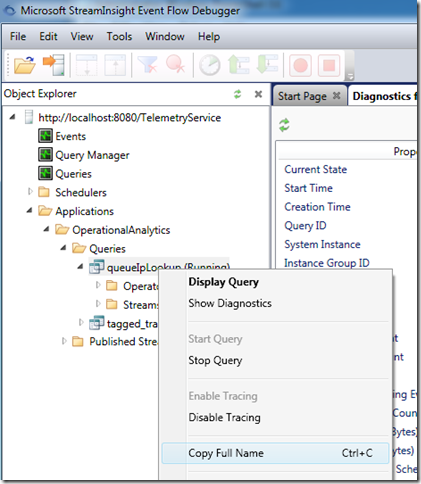
This is a snapshot a web analytics application that I’ll be talking about at SQL PASS (and in a series of blog posts in December), for now, pretend it is a view of your own application

Right-click on the query, then click on Show Diagnostics. This will bring up the basic diagnostic view for the query.
A snapshot of the diagnostic view looks like:
Lots of great information in the diagnostic view; full documentation for the views and the meaning of the various properties can be reviewed in the Monitoring the StreamInsight Server and Queries page on MSDN.
Basic Views through PowerShell
Let’s use PowerShell to look up the same information (with the intent of leveraging PowerShell’s scripting abilities to perform custom views, filters, etc on top of the data).
Code Snippet
- # Set the URL to the StreamInsight service
- $serviceUrl = "https://localhost:8080/TelemetryServicex"
- # Load the StreamInsight assembly
- $n = [System.Reflection.Assembly]::LoadWithPartialName(
- "Microsoft.ComplexEventProcessing")
- $server = [Microsoft.ComplexEventProcessing.Server]::Connect($serviceUrl)
- # Test the connection to the server
- $server.Applications
This code snippet executes the basic steps required to work with the StreamInsight management API in PowerShell. This dynamically loads up the DLL, creates a server object, and enumerates the list of the applications (thus triggering a call to the remote server). If the remote server isn’t available (URL is wrong, etc – as per the steps above), the error message will look something like:
|
I generated this particular error message by having an invalid $serviceUrl setting. Assuming that we’ve established a good connection, we should see the list of available applications (which in turn contain queries).
|
In my case, I have an OperationalAnalytics application, which corresponds to the view in the Object Explorer. To get the diagnostic view shown in the event flow debugger, we retrieve the diagnostic view. In this case, I’m going to cheat a bit by retrieving the query’s URI (path to the query in the StreamInsight engine’s metadata store) from the Event Flow Debugger:
- From the Object Explorer, click on the expand button next to the Applications node.
- Right-click on the query, then click on Copy Full Name. This will copy the query’s URI onto the clipboard.
Just pasting out the name to notepad shows the URI below; this can be passed to the GetDiagnosticView method to look up the diagnostic values shown in the event flow debugger Show Diagnostics screen in the previous section.
cep:/Server/Application/OperationalAnalytics/Query/queueIpLookup
 PS C:\Users\masimms> $server.GetDiagnosticView("cep:/Server/Application/OperationalAnalytics/Query/queueIpLookup")

Key                                        Value
---                                        -----
QueryState                                 Running
QueryStartTime                             10/20/2010 10:01:07 PM
QueryCreationTime                          10/20/2010 10:01:07 PM
QueryId                                    4503599627370497
QuerySystemInstance                        False
QueryInstanceGroupId                       0
PublishedStreamId                          4503599627370501
PublishedStreamEventShape                  Point
PublishedStreamEventType                   <EventType Name="Project.1.4" xmlns="h...
PublishedStreamProducerCount               1
PublishedStreamConsumerCount               0
StreamEventCount                           0
StreamMemoryIncludingEvents                0
OperatorIndexEventCount                    0
OperatorEventMemory                        0
OperatorIndexMemory                        0
OperatorTotalScheduledCount                0
OperatorTotalCpuUsage                      0
PublishedStreamEventCount                  0
PublishedStreamTotalEventCount             0
QueryTotalIncomingEventCount               0
QueryTotalConsumedEventCount               0
QueryTotalProducedEventCount               0
QueryTotalOutgoingEventCount               0
QueryTotalConsumedEventLatency             0
QueryTotalProducedEventLatency             0
QueryTotalOutgoingEventLatency             0
QueryLastProducedCtiTimestamp              1/1/0001 12:00:00 AM
In the next blog post, I’ll cover how to look this information up dynamically, walk through the metadata set, look for interesting conditions and patterns as well as converting these data sets into native PowerShell objects.
Comments
- Anonymous
October 22, 2010
Forgot to include a link to the blog post that walks through the trace class that I use:blogs.msdn.com/.../creating-a-basic-logging-wrapper-for-streaminsight-adapters-applications-using-log4net.aspx


