Analyze Network Latency Impact on Remote Availability Group Replica
Multisite availability groups allow customers to deploy copies of business data across multiple sites, for disaster recovery and/or for reporting purposes, offering near real-time changes available to the copies of the production data at remote locations.
If secondary replicas are hosted greater distances from the primary replica, network latency can begin to impact availability group synchronization’s ability to keep the secondary up to date with the changes made at the primary replica.
Symptom - Sustained or Growing Log Send Queue
When network latency becomes an issue the most common symptom you will observe is sustained or growing log send queue. Simply defined, log send queue is the changes stored in the transaction log of your availability group database on the primary replica that have not yet arrived and hardened to the transaction log of the availability group on the secondary replica.
Why should you care? The log send queue represents all the data that can be lost from a catastrophic failure. If your primary replica was lost in a sudden disaster, and you were forced to fail over to the secondary replica where these changes have not yet arrived, your business would incur data loss.
Log send queue is a per-database measurement. Here are ways you can actively monitor your availability group database log send queue.
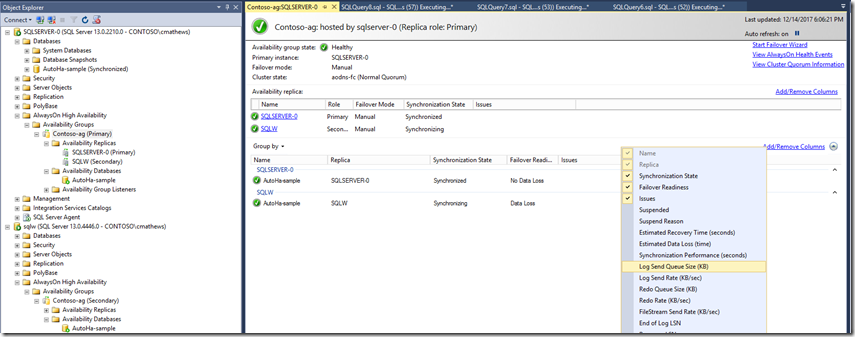
Add the Log Send Queue size (KB) column in AlwaysOn Dashboard In SQL Server Management Studio Object Explorer, right click on your availability group and choose Show Dashboard. The dashboard will appear in the right pane. Right-click the column header above the list of databases in your availability group and choose to add Log Send Queue Size (KB).
The column is added and reports the current queue size in KB.
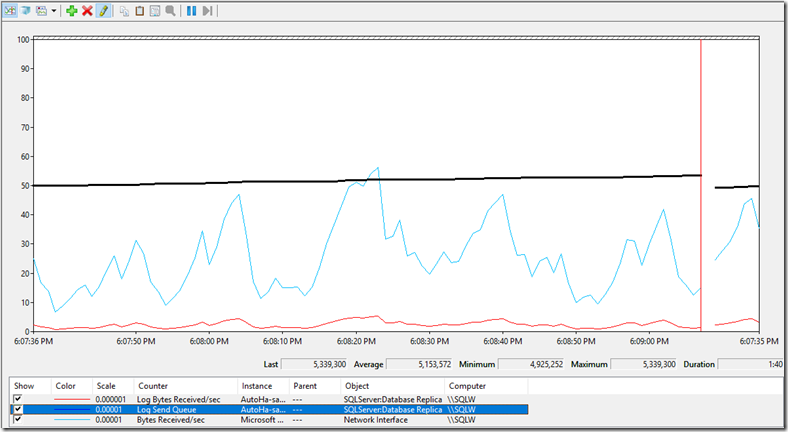
Add the SQLServer:Database Replica:Log Send Queue Counter On the secondary replica, add the SQLServer:Database Replica:Log Send Queue counter for the database instance whose log send queue you are monitoring.
Measure Network Latency Impact Using Performance Monitor
In the following demo we measure the impact of network latency on log send queue growth. We can use SQL Server performance monitor counters on the primary and secondary replicas during synchronization of a load which results in log send queue growth. Compression is disabled during this load test in order to put more load on the network.
On the secondary replica, launch Performance Monitor and add the following counters:
SQLServer:Database Replica:Log Bytes Received/sec for appropriate database instance
SQLServer:Database Replica:Recovery Queue for appropriate database instance
On the primary replica, launch Performance Monitor and add the following counters:
SQLServer:Databases:Log Bytes Flushed/sec for appropriate database instance
Network Interface:Sent Bytes/sec for appropriate adapter instance
Once you have Performance Monitor running, initiate the load that leads to log send queuing, and monitor the counters.
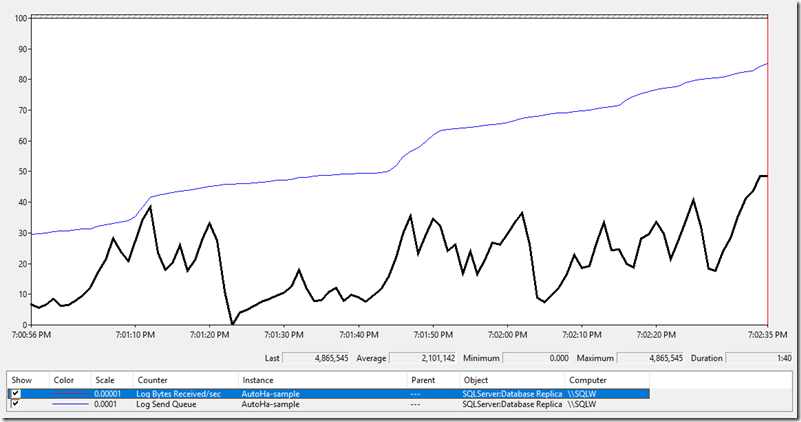
Review the performance monitor counters on the secondary, we can see Log Bytes Received/sec for our availability group database is averaging 2.1 mb/sec. Note that the Log Send Queue for the database is continually growing meaning that there are a growing number of changes that have occurred at the primary replica that are stored in the transaction log there that have not yet arrived and hardened on the transaction log of the local database on the secondary replica.
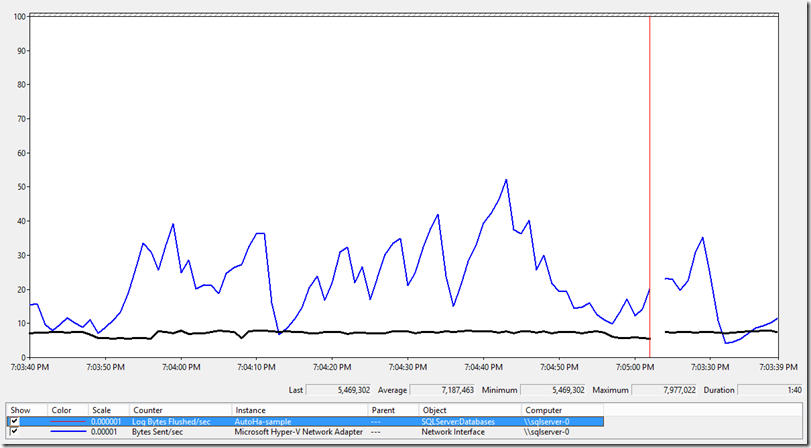
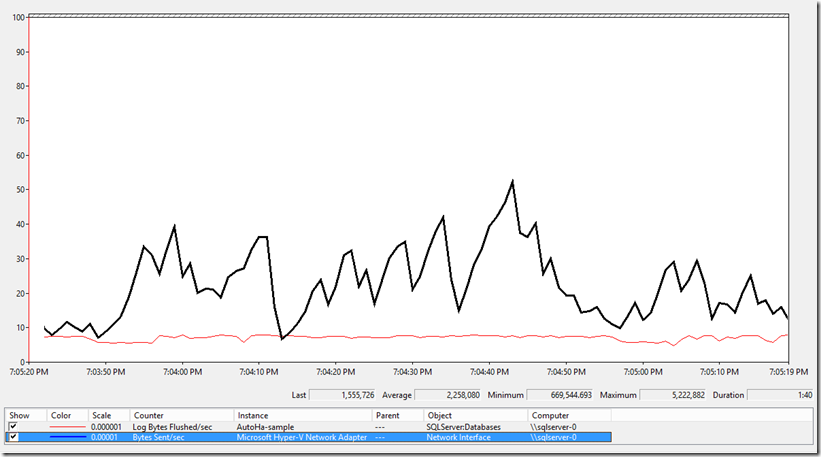
Now, on the primary replica, check the availability group database’s Log Bytes Flushed/sec. We see that our load is generating and hardening on average 7.1 mb/sec to the local transaction log.
Clearly, if we are generating over 7 mb/sec of logged changes at the primary but only receiving 2 mb/sec of changes at the secondary, we can expect log send queue growth. These observations can lead us to begin to consider network latency as a possible cause for our growing log send queue.
On the primary, check the Network Interface:Bytes Sent/sec for the correct network adapter instance. On average, the primary is sending 2.2 mb/sec, and we can expect that nearly all of that is to the secondary replica where we observed comparable Log Bytes Received/sec.
Measure your network throughput independently of SQL Server
In order to better understand how fast an application can push changes to the remote server, use a third party network bandwidth performance tool, like iPerf or NTttcp. The following demo is using iPerf on the same operating environment as the prior demo.
These tools use a default port to communicate with each other, so it may be necessary to open that port, in the case of iPerf, it uses 5201 by default.
IMPORTANT It is important to configure the tool to use a single connection to send data, since SQL Server uses a single connection to send synchronization changes from the primary to the secondary replica.
Test network throughput with iPerf
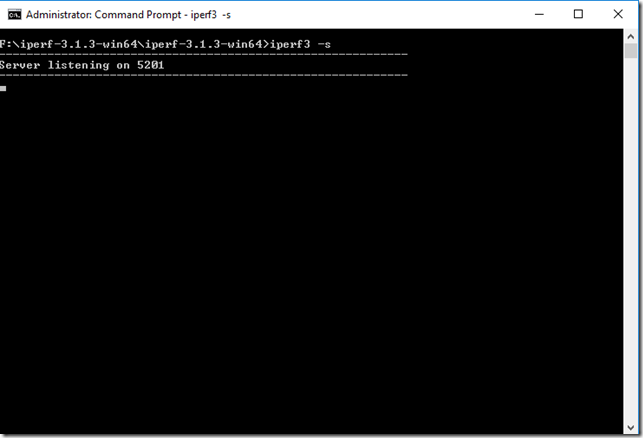
On the remote secondary replica, launch iPerf with the –s parameter and it will begin to listen for a connection over port 5201.
iperf3 –s
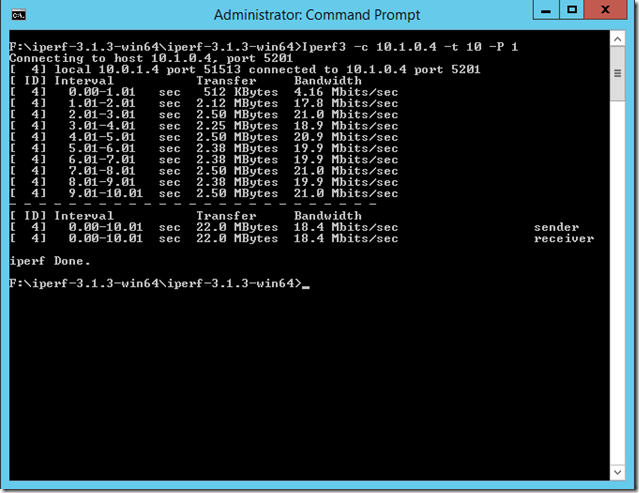
On the SQL Server hosting the primary replica, launch iPerf using the following parameters, and it will begin a transmission with the remote SQL Server.
Here are the parameters.
-c ip address of destination server
–P 1 Use a single connection in the test
–t 10 Perform 10 one second transfers
Here is the command line;
iperf –c <<secondaryipaddress>> –t 10 –P 1
iPerf is reporting it can send between 2.12 and 2.50 mb/sec to the remote secondary server. This rate is very comparable to the rates we observed above in our load test using SQL Server.
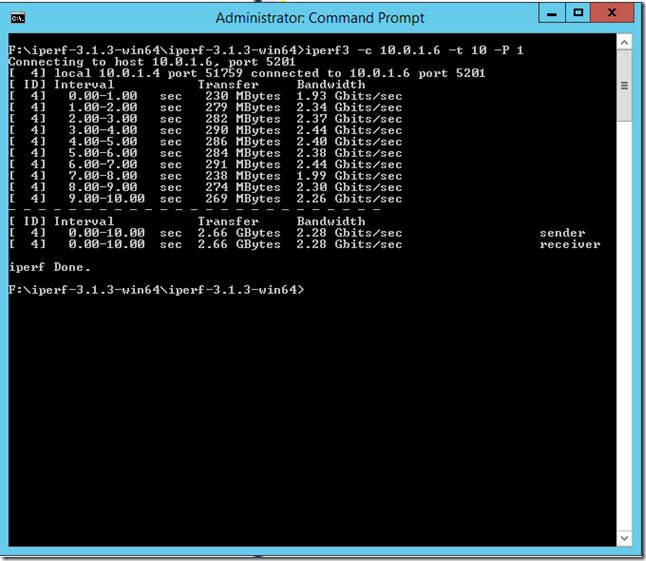
Testing a server that is closer to your primary replica can provide a useful foil when doing this test. Below, I run the same test from the primary this time to a destination server in the same data center and subnet as the primary server. Here are the test results, noticeably higher throughput when the destination server is in closer proximity and same subnet.
Test network throughput with NTttcp
Below is a demonstration of using NTttcp.exe in the same environment as above.
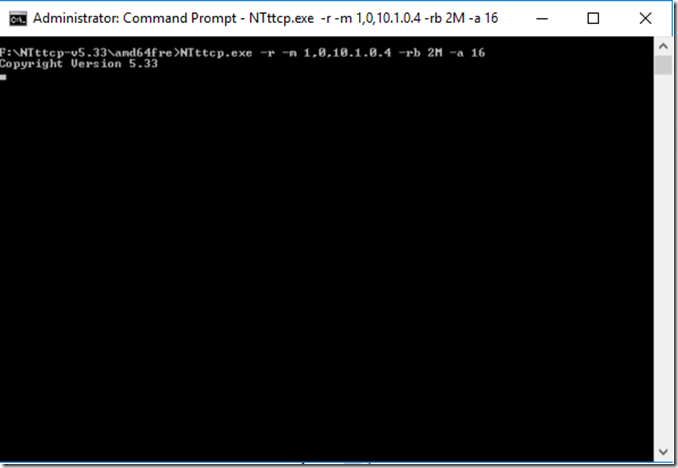
On the remote secondary replica (the receiver), launch NTttcp as follows, here –m 1 is for single threaded, and the IP address of the local receiver server.
NTttcp.exe –r –m 1,0,10.1.0.4 –rb 2M –a 16
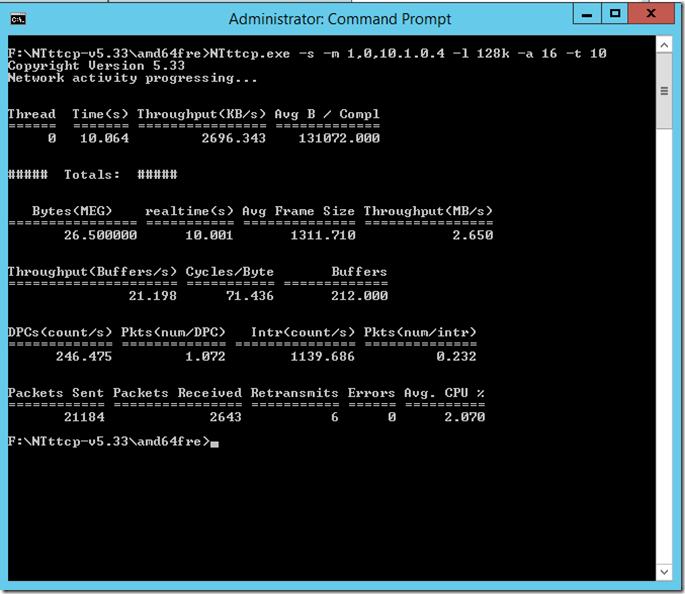
On the primary replica (the sender), initiate the test by executing the following, again supplying the IP address of the receiver. This test is for 10 seconds (-t 10):
NTttcp.exe –s –m 1,0,10.1.0.4 –l 128k –a 16 –t 10
The results report about 2.7 mb/sec which is similar to the testing results obtained from iPerf and from our performance monitor log.
In Conclusion
This testing can help you to determine if network latency is impacting log send queue for remote asynchronous replicas in your availability group. Log send queuing can impact your recovery point objective (RPO) and as described earlier in this blog translate to potential data loss.
For more information on recovery point objective and the potential for data loss see
If you find that network latency is having an impact, consider using netsh or another network trace tool to check for retransmits, dropped packets, etc.
