Identify ASP.NET, Web Services, And WCF Performance Issues By Examining IIS Logs
Simple examination of IIS logs can reveal potential performance issues related to ASP.NET web applications, ASP.NET web services, and IIS hosted WCF services. Fast, easy, cheap.
These are the simple steps I take:
- Time-Taken & W3C Logs: Turn it on...
- Collect the data in the IIS logs
- Open IIS logs in MS Excel 2007
- Analyze the logged data using Excel 2007 Data Filtering and Pivot Tables
- Pitfalls
The following are the detailed explanation for each step
The most valuable friend to an IT Professional or Developer who uses IIS is a little-bitty check-mark field that is not enabled by default...
1). Open IIS Manager (Start – Run – Inetmgr)
2). Right-click on the Web Sites tab (IIS 6 only — IIS 5 customers right-click on Server)
3). Choose Properties
4). On the General tab, select the Properties for Logging
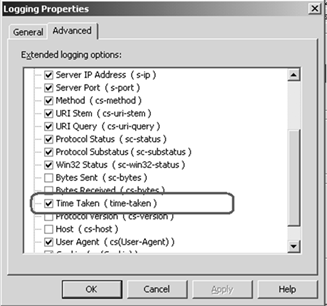
5). On the advanced tab, scroll down and check “Time-Taken”
6). Click Ok, Ok
- Collect the data in the IIS logs.
The most easiest way would be collecting the data in QA environment. When a new app version is deployed to QA environment the application is used constantly and there is no special logistics needed to conduct the test. QA team runs its scenarios and IIS logs the data.
- Open IIS logs in MS Excel 2007.
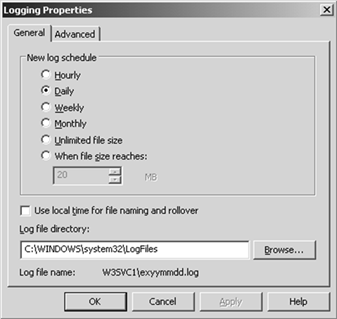
At the end of the QA test collect the log files and copy them to your place of choice - I copy it locally to my laptop. The log files are usually located in C:\Windows\System32\LogFiles\W3SVC1. The location, of course, is customizable though IIS MMC:
Start Excel 2007, hit ctrl+O [for Open] to open the log file. Chose "Delimited" for file type in the "Text Import Wizard" and hit Next button:
Tick "Space" on for "Delimiters" in the next step of the wizard and hit Next button:
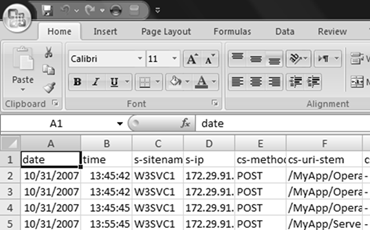
After the log file is opened in Excel it should look something like this:
- Analyze the logged data using Excel 2007 Data Filtering and Pivot Tables
Following are the properties that deserve most attention
sc-bytes - The number of bytes that the server sent.
cs-bytes - The number of bytes that the server received.
time-taken - The length of time that the action took, in milliseconds.
Use Excel's Data Sort functionality immediately spot the trouble makers:
Check the corresponding cs-uri-stem property values that contains the URL (usually ASPX, ASMX, or SVC file). In the above sample first row shows acceptable network utilization - client sent about 3Kb and server sent back about 2 Kb. But it took quite a lot to process it - almost 2 minutes. Seems like IIS consumes time (for example, authentication can take quite a lot of time in case where communication to DC is not the best) or ASP.NET code is written inefficiently (for example dynamically built server controls, nested loops and recursion, or inefficient DB access). Second to fourth rows show that the server returns about 9 Mb of data - it naturally takes quite a lot of time to process it - about 35 seconds.
Excel 2007 has even cooler functionality - pivot tables. Insert pivot table into the spread sheet:
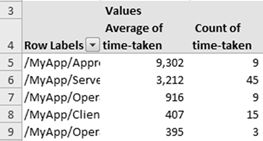
Drag cs-uri-stem to "Row Labels" area and time-taken to "Values" area twice. Configure to show average and count for time-taken property:
The end result is nice summary table:
Same can be done with sc-bytes or cs-bytes to examine the http traffic averages.
- Pitfalls
Be careful when calculating averages for time-taken property. Double click on any row in the pivot table presents the detailed tabular data. For example, here is the data behind the first row in the above example:
Notice sc-status column. It is the HTTP status code. 401 is out of our interest thus must be filtered out to calculate the actual response processing time. Use Excel Data Filter functionality to do so. Finally, the more realistic average - about 27 seconds - calculated for HTTP 200 responses:
Enjoy.
My related posts
- Typed DataSet - Potential Performance And Security Risk
- Performance Testing Objectives Document Template
- Performance Testing For The Masses
Related resources
- Now on MSDN: patterns & practices Performance Testing Guidance for Web Applications
- Performance Testing Videos Posted to CodePlex
Comments
- Anonymous
December 18, 2007
PingBack from http://dstelow.wordpress.com/2007/12/18/links-for-2007-12-18/ - Anonymous
January 01, 2008
During recent few engagements with my customers I've noticed  VIewState is extensively [unintentionally] - Anonymous
January 16, 2008
Ever wondered why your application unreasonably slow? You have it all - most powerful hardware, your - Anonymous
March 08, 2008
Building ASP.NET web applications? Plan to serve thousands of users? Would you like to see how your application - Anonymous
March 11, 2008
How to anticipate or better off avoid performance related "surprises" during load and stress - Anonymous
April 20, 2008
These free performance tools will save you time and money identifying performance bottlenecks. Your customers - Anonymous
April 21, 2008
The comment has been removed - Anonymous
July 20, 2008
Have you noticed that when ASP.NET web application is accessed for the first time the response is slow? - Anonymous
November 01, 2008
Field experience proves - the earlier performance is tackled in development lifecycle the better results - Anonymous
June 01, 2009
English: Simple ways to find and destroy IIS hangs/timeout's. אחת התופעות המרגיזות ביותר היא אתר


