How to: Pause and resume performance data collection
Applies to: ![]() Visual Studio
Visual Studio ![]() Visual Studio for Mac
Visual Studio for Mac
Note
This article applies to Visual Studio 2017. If you're looking for the latest Visual Studio documentation, see Visual Studio documentation. We recommend upgrading to the latest version of Visual Studio. Download it here
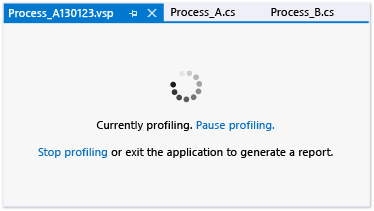
From the profiling session page window, you can control the collection of profiling data interactively.
Controlling data collection enables you to reduce the size of the profile data file, and to collect data only for those operations that you are interested in. You can pause and resume profiling multiple times in a performance session.

Note
You can also start the performance session with profiling paused, then resume profiling at a later point in the program execution. To start the performance session with profiling paused, choose Start Performance Analysis with Profiling Paused command on the Debug menu.
To pause, resume, or stop profiling
On the profiling session page:
Choose Pause Collection to suspend data collection.
Choose Resume Collection to restart data collection after it has been paused.
Choose Stop profiling to end the profiling session and generate reports.