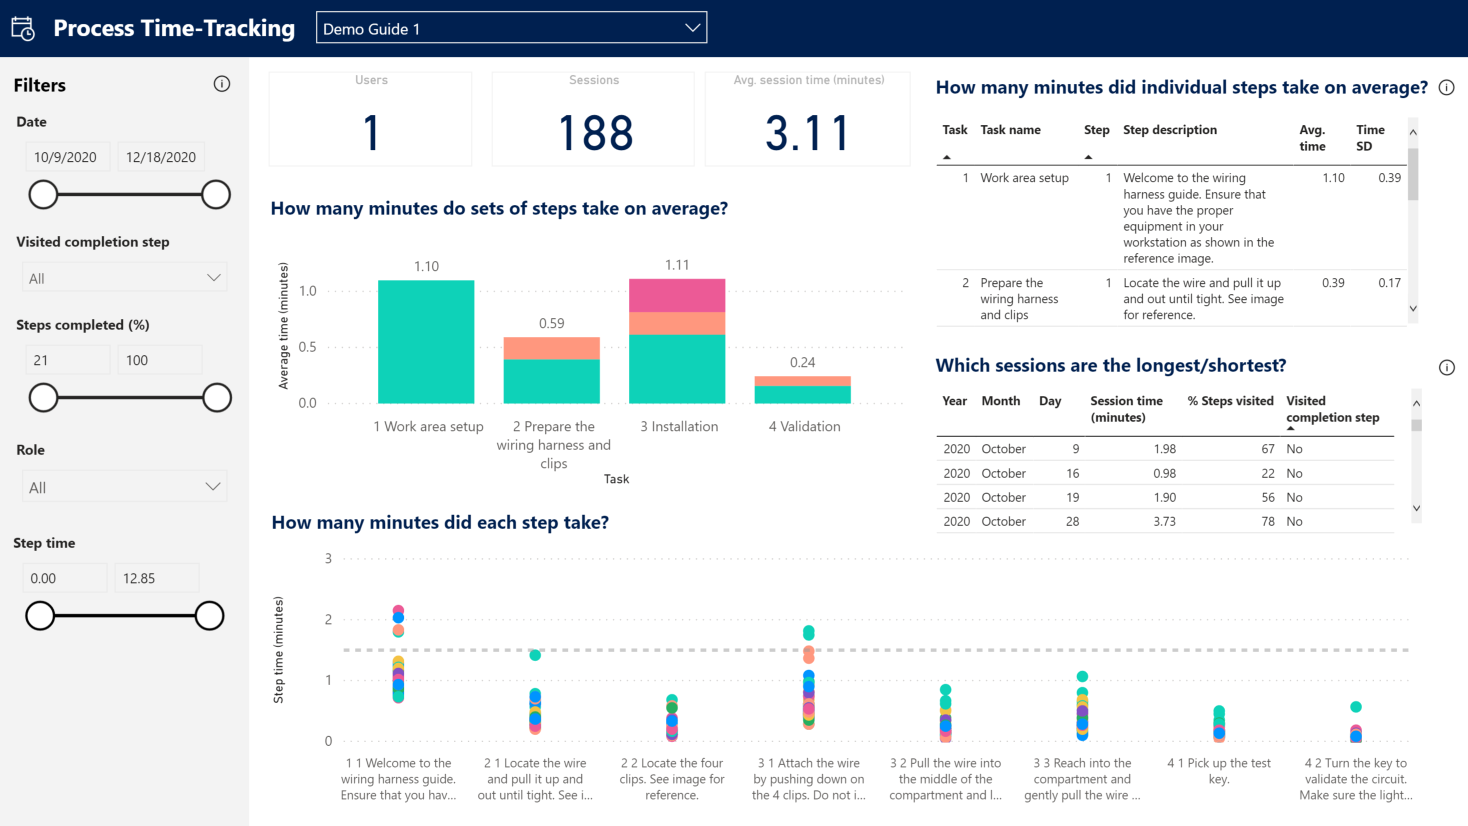
Gain insights into guide usage with the updated Guides Analytics Power BI reports
Important
This content is archived and is not being updated. For the latest documentation, see Microsoft Dynamics 365 product documentation. For the latest release plans, see Dynamics 365 and Microsoft Power Platform release plans.
| Enabled for | Public preview | General availability |
|---|---|---|
| Admins, makers, marketers, or analysts, automatically | - |  Feb 3, 2021
 |
Business value
The Power BI reports have been redesigned to help managers track guide usage across their organization and help process engineers quickly identify areas for process improvement.
Feature details
Key improvements to the Power BI reports include the ability to compare average operation times across tasks or steps of interest. This can be particularly valuable when analyzing the operation times of different guide branches. The reports also make it easy to identify steps that exceed a target time or have highly variable operation times, which might indicate areas for process improvement. By filtering for guide sessions in which the operator completed the guide, you can now access higher quality time measurements.

See also
Take a tour of Guides Analytics reports for Dynamics 365 Guides (docs)