Power BI ビジュアルでデータ ポイントを強調表示する
この記事では Power BI ビジュアル上のデータを強調表示する方法について説明します。
既定では、要素を選択すると、dataView objectのvalues配列がフィルター処理され、選択した値のみが表示されます。 values 配列がフィルター処理されると、ページ上にある他のすべての視覚化には、選択されたデータのみが表示されます。
capabilities.json ファイルの supportsHighlight プロパティを true に設定すると、フィルター処理されていない完全な values 配列が highlights 配列とともに生成されます。 highlights 配列は values 配列と同じ長さになり、選択されていない値はすべて null に設定されます。 このプロパティを有効にすると、values 配列を highlights 配列と比較することで、視覚化の適切なデータが強調表示されます。
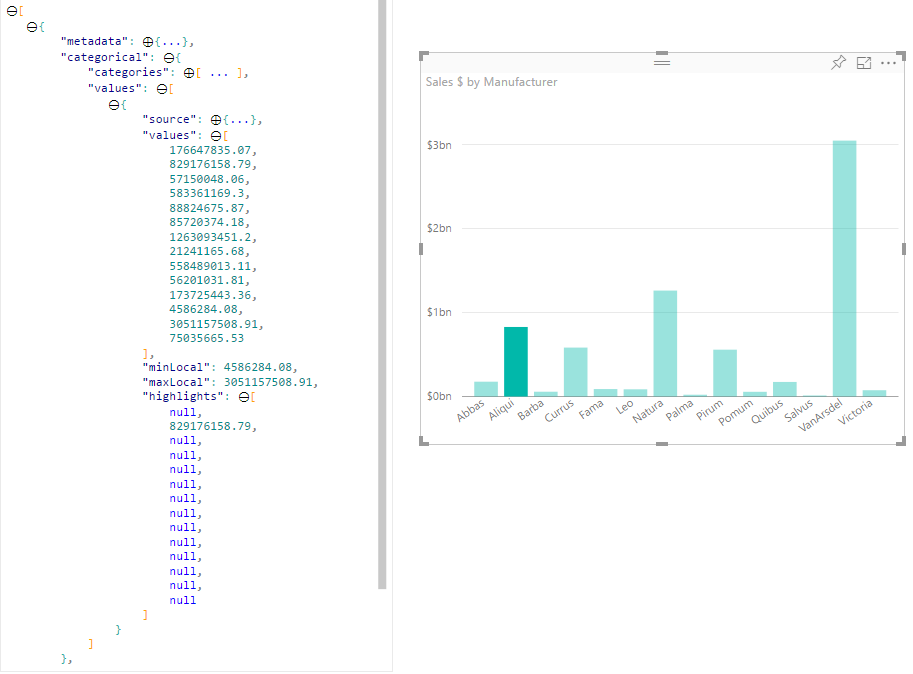
この例では、次のことがわかります。
- 強調表示のサポートなしの場合、選択内容は
values配列の唯一の値であり、データ ビューに表示される唯一の棒です。 - 強調表示のサポートありの場合、すべての値は
values配列内にあります。highlights配列には、強調表示されていない要素のnullの値が含まれます。 データ ビューにはすべての棒が表示され、強調表示された棒は異なる色で表示されます。
また、複数選択や部分的な強調表示も可能です。 強調表示された値は、データ ビューに表示されます。
注意
テーブル データ ビューのマッピングでは、強調表示機能がサポートされていません。
カテゴリ別のデータ ビューのマッピングを持つデータ ポイントを強調表示する
カテゴリ別のデータ ビューのマッピングが含まれるビジュアルの場合、"supportsHighlight": true を capabilities.json ファイルに追加します。 次に例を示します。
{
    "dataRoles": [
        {
            "displayName": "Category",
            "name": "category",
            "kind": "Grouping"
        },
        {
            "displayName": "Value",
            "name": "value",
            "kind": "Measure"
        }
    ],
    "dataViewMappings": [
        {
            "categorical": {
                "categories": {
                    "for": {
                        "in": "category"
                    }
                },
                "values": {
                    "for": {
                        "in": "value"
                    }
                }
            }
        }
    ],
    "supportsHighlight": true
}
不要なコードを削除すると、既定の視覚化ソース コードは次の例のようになります。
"use strict";

// ... default imports list

import { FormattingSettingsService } from "powerbi-visuals-utils-formattingmodel";

import DataViewCategorical = powerbi.DataViewCategorical;
import DataViewCategoryColumn = powerbi.DataViewCategoryColumn;
import PrimitiveValue = powerbi.PrimitiveValue;
import DataViewValueColumn = powerbi.DataViewValueColumn;

import { VisualFormattingSettingsModel } from "./settings";

export class Visual implements IVisual {
    private target: HTMLElement;
    private formattingSettings: VisualFormattingSettingsModel;
    private formattingSettingsService: FormattingSettingsService;

    constructor(options: VisualConstructorOptions) {
        console.log('Visual constructor', options);
        this.formattingSettingsService = new FormattingSettingsService();
        this.target = options.element;
        this.host = options.host;
    }

    public update(options: VisualUpdateOptions) {
        this.formattingSettings = this.formattingSettingsService.populateFormattingSettingsModel(VisualFormattingSettingsModel, options.dataViews);
        console.log('Visual update', options);

    }

    // Returns properties pane formatting model content hierarchies, properties and latest formatting values, Then populate properties pane.
    // This method is called once every time we open properties pane or when the user edit any format property.
    public getFormattingModel(): powerbi.visuals.FormattingModel {
        return this.formattingSettingsService.buildFormattingModel(this.formattingSettings);
    }
}
Power BI のデータを処理するために必要なインターフェイスをインポートします。
import DataViewCategorical = powerbi.DataViewCategorical;
import DataViewCategoryColumn = powerbi.DataViewCategoryColumn;
import PrimitiveValue = powerbi.PrimitiveValue;
import DataViewValueColumn = powerbi.DataViewValueColumn;
カテゴリ値のルート div 要素を作成します。
export class Visual implements IVisual {
    private target: HTMLElement;
    private formattingSettings: VisualFormattingSettingsModel;
    private formattingSettingsService: FormattingSettingsService;

    private div: HTMLDivElement; // new property

    constructor(options: VisualConstructorOptions) {
        console.log('Visual constructor', options);
        this.formattingSettingsService = new FormattingSettingsService();
        this.target = options.element;
        this.host = options.host;

        // create div element
        this.div = document.createElement("div");
        this.div.classList.add("vertical");
        this.target.appendChild(this.div);

    }
    // ...
}
新しいデータをレンダリングする前に、div 要素の内容を消去します。
// ...
public update(options: VisualUpdateOptions) {
    this.formattingSettings = this.formattingSettingsService.populateFormattingSettingsModel(VisualFormattingSettingsModel, options.dataViews);
    console.log('Visual update', options);

    while (this.div.firstChild) {
        this.div.removeChild(this.div.firstChild);
    }
    // ...
}
dataView オブジェクトからカテゴリとメジャー値を取得します。
public update(options: VisualUpdateOptions) {
    this.formattingSettings = this.formattingSettingsService.populateFormattingSettingsModel(VisualFormattingSettingsModel, options.dataViews);
    console.log('Visual update', options);

    while (this.div.firstChild) {
        this.div.removeChild(this.div.firstChild);
    }

    const dataView: DataView = options.dataViews[0];
    const categoricalDataView: DataViewCategorical = dataView.categorical;
    const categories: DataViewCategoryColumn = categoricalDataView.categories[0];
    const categoryValues = categories.values;

    const measures: DataViewValueColumn = categoricalDataView.values[0];
    const measureValues = measures.values;
    const measureHighlights = measures.highlights;
    // ...
}
ここで、categoryValues はカテゴリ値の配列であり、measureValues はメジャーの配列であり、measureHighlights は値の強調表示部分です。
Note
measureHighlights プロパティの値が categoryValues プロパティの値より小さい場合、値は部分的に強調表示されました。
categoryValues 配列を列挙し、対応する値と強調表示を取得します。
// ...
const measureHighlights = measures.highlights;

categoryValues.forEach((category: PrimitiveValue, index: number) => {
    const measureValue = measureValues[index];
    const measureHighlight = measureHighlights && measureHighlights[index] ? measureHighlights[index] : null;
    console.log(category, measureValue, measureHighlight);

});
div および p 要素を作成して、視覚化の DOM でデータ ビュー値を表示および視覚化します。
categoryValues.forEach((category: PrimitiveValue, index: number) => {
    const measureValue = measureValues[index];
    const measureHighlight = measureHighlights && measureHighlights[index] ? measureHighlights[index] : null;
    console.log(category, measureValue, measureHighlight);

    // div element. it contains elements to display values and visualize value as progress bar
    let div = document.createElement("div");
    div.classList.add("horizontal");
    this.div.appendChild(div);

    // div element to visualize value of measure
    let barValue = document.createElement("div");
    barValue.style.width = +measureValue * 10 + "px";
    barValue.style.display = "flex";
    barValue.classList.add("value");

    // element to display category value
    let bp = document.createElement("p");
    bp.innerText = category.toString();

    // div element to visualize highlight of measure
    let barHighlight = document.createElement("div");
    barHighlight.classList.add("highlight")
    barHighlight.style.backgroundColor = "blue";
    barHighlight.style.width = +measureHighlight * 10 + "px";

    // element to display highlighted value of measure
    let p = document.createElement("p");
    p.innerText = `${measureHighlight}/${measureValue}`;
    barHighlight.appendChild(bp);

    div.appendChild(barValue);

    barValue.appendChild(barHighlight);
    div.appendChild(p);
});
flexbox を使用するために必要なスタイルを要素に適用し、div 要素の色を定義します。
div.vertical {
    display: flex;
    flex-direction: column;
}

div.horizontal {
    display: flex;
    flex-direction: row;
}

div.highlight {
    background-color: blue
}

div.value {
    background-color: red;
    display: flex;
}
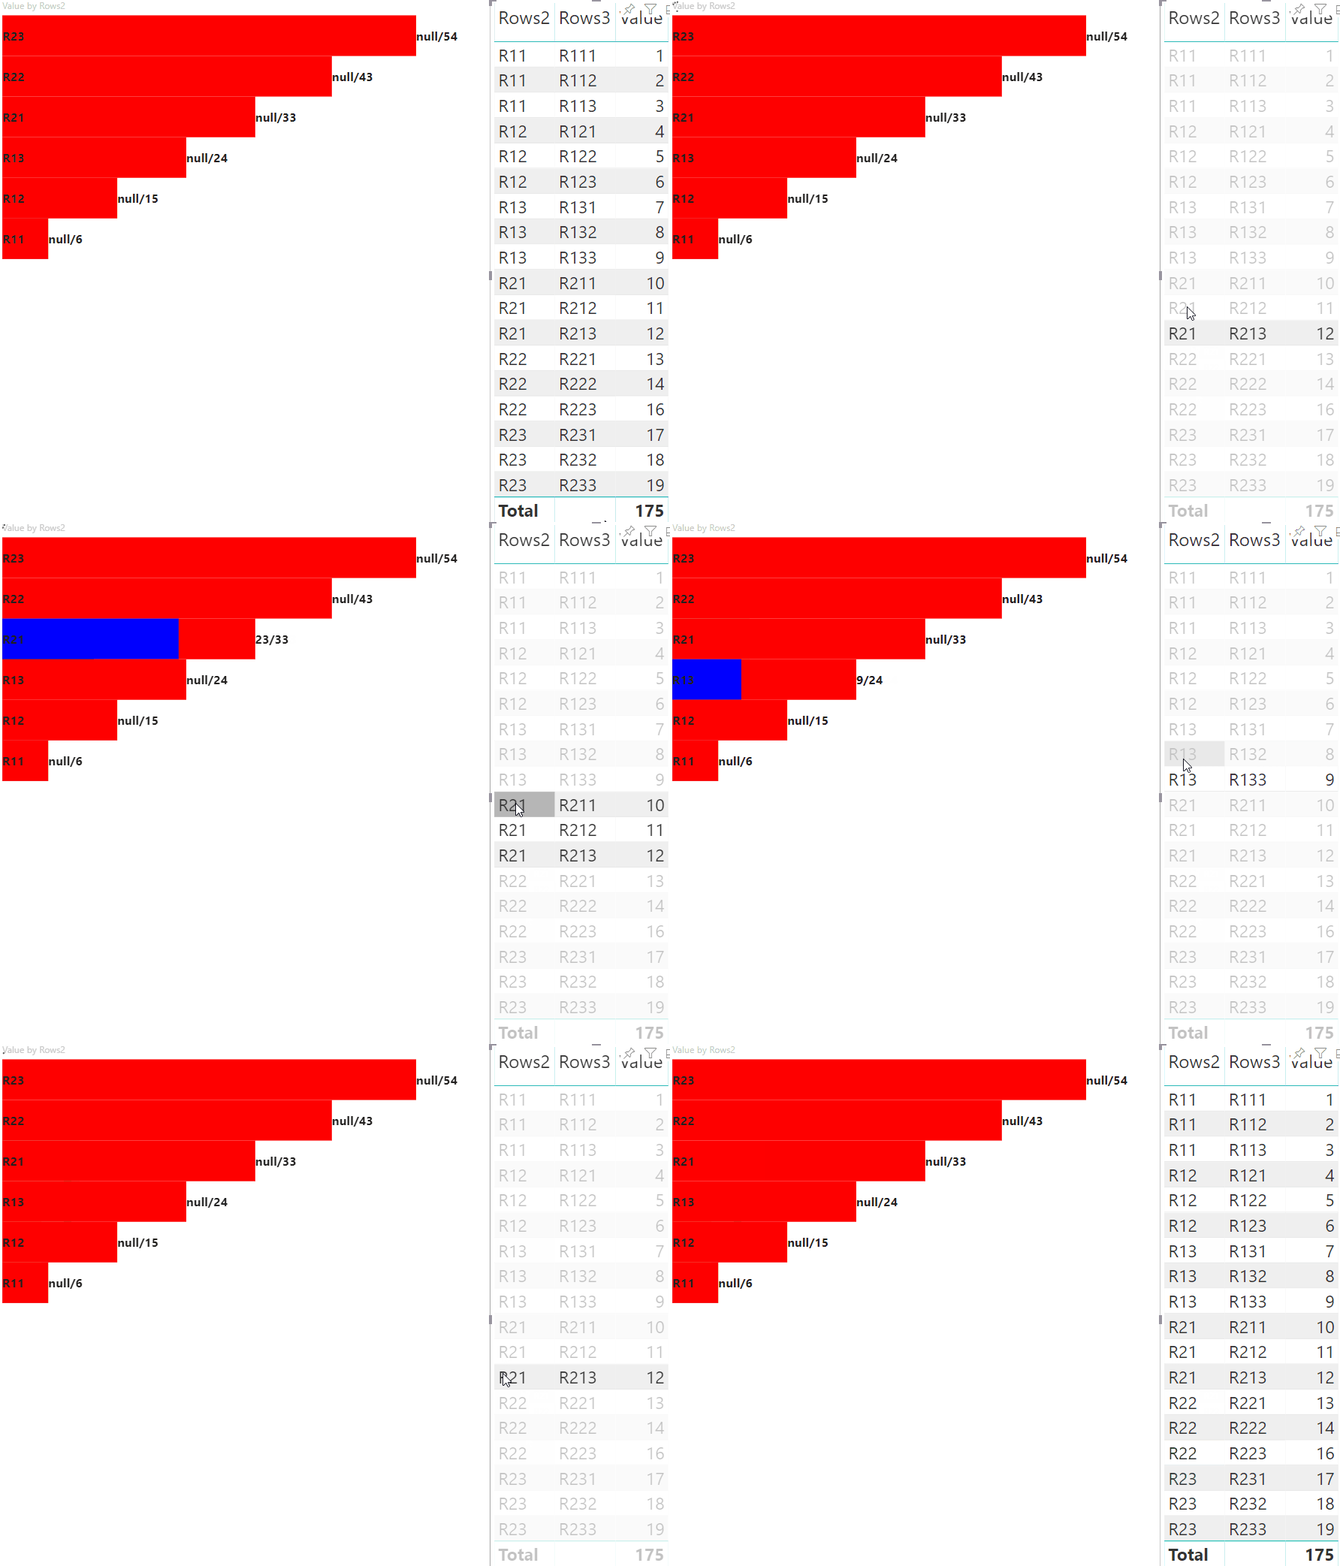
結果として、視覚化の次のビューが表示されます。

マトリックスのデータ ビューのマッピングを持つデータ ポイントを強調表示する
マトリックス データ ビューのマッピングが含まれるビジュアルの場合、"supportsHighlight": true を capabilities.json ファイルに追加します。 次に例を示します。
{
    "dataRoles": [
        {
            "displayName": "Columns",
            "name": "columns",
            "kind": "Grouping"
        },
        {
            "displayName": "Rows",
            "name": "rows",
            "kind": "Grouping"
        },
        {
            "displayName": "Value",
            "name": "value",
            "kind": "Measure"
        }
    ],
    "dataViewMappings": [
        {
            "matrix": {
                "columns": {
                    "for": {
                        "in": "columns"
                    }
                },
                "rows": {
                    "for": {
                        "in": "rows"
                    }
                },
                "values": {
                    "for": {
                        "in": "value"
                    }
                }
            }
        }
    ],
    "supportsHighlight": true
}
マトリックスのデータ ビュー マッピングの階層を作成するためのサンプル データ。
| 行 1 | 行 2 | 行 3 | 列 1 | 列 2 | 列 3 | 値 |
|---|---|---|---|---|---|---|
| R1 | R11 | R111 | C1 | C11 | C111 | 1 |
| R1 | R11 | R112 | C1 | C11 | C112 | 2 |
| R1 | R11 | R113 | C1 | C11 | C113 | 3 |
| R1 | R12 | R121 | C1 | C12 | C121 | 4 |
| R1 | R12 | R122 | C1 | C12 | C122 | 5 |
| R1 | R12 | R123 | C1 | C12 | C123 | 6 |
| R1 | R13 | R131 | C1 | C13 | C131 | 7 |
| R1 | R13 | R132 | C1 | C13 | C132 | 8 |
| R1 | R13 | R133 | C1 | C13 | C133 | 9 |
| R2 | R21 | R211 | C2 | C21 | C211 | 10 |
| R2 | R21 | R212 | C2 | C21 | C212 | 11 |
| R2 | R21 | R213 | C2 | C21 | C213 | 12 |
| R2 | R22 | R221 | C2 | C22 | C221 | 13 |
| R2 | R22 | R222 | C2 | C22 | C222 | 14 |
| R2 | R22 | R223 | C2 | C22 | C223 | 16 |
| R2 | R23 | R231 | C2 | C23 | C231 | 17 |
| R2 | R23 | R232 | C2 | C23 | C232 | 18 |
| R2 | R23 | R233 | C2 | C23 | C233 | 19 |
既定の視覚化プロジェクトを作成し、capabilities.json ファイルのサンプルを適用します。
不要なコードを削除すると、既定の視覚化ソース コードは次の例のようになります。
"use strict";

// ... default imports

import { FormattingSettingsService } from "powerbi-visuals-utils-formattingmodel";
import { VisualFormattingSettingsModel } from "./settings";

export class Visual implements IVisual {
    private target: HTMLElement;
    private formattingSettings: VisualFormattingSettingsModel;
    private formattingSettingsService: FormattingSettingsService;

    constructor(options: VisualConstructorOptions) {
        console.log('Visual constructor', options);
        this.formattingSettingsService = new FormattingSettingsService();
        this.target = options.element;
        this.host = options.host;
    }

    public update(options: VisualUpdateOptions) {
        this.formattingSettings = this.formattingSettingsService.populateFormattingSettingsModel(VisualFormattingSettingsModel, options.dataViews);
        console.log('Visual update', options);

    }

   /**
     * Returns properties pane formatting model content hierarchies, properties and latest formatting values, Then populate properties pane.
     * This method is called once every time we open properties pane or when the user edit any format property.
     */
    public getFormattingModel(): powerbi.visuals.FormattingModel {
        return this.formattingSettingsService.buildFormattingModel(this.formattingSettings);
    }
}
Power BI のデータを処理するために必要なインターフェイスをインポートします。
import DataViewMatrix = powerbi.DataViewMatrix;
import DataViewMatrixNode = powerbi.DataViewMatrixNode;
import DataViewHierarchyLevel = powerbi.DataViewHierarchyLevel;
視覚化レイアウト用に、2 つの div 要素を作成します。
constructor(options: VisualConstructorOptions) {
    // ...
    this.rowsDiv = document.createElement("div");
    this.target.appendChild(this.rowsDiv);

    this.colsDiv = document.createElement("div");
    this.target.appendChild(this.colsDiv);
    this.target.style.overflowY = "auto";
}
update メソッド内でデータを調べて、視覚化がデータを取得することを確認します。
public update(options: VisualUpdateOptions) {
    this.formattingSettings = this.formattingSettingsService.populateFormattingSettingsModel(VisualFormattingSettingsModel, options.dataViews);
    console.log('Visual update', options);

    const dataView: DataView = options.dataViews[0];
    const matrixDataView: DataViewMatrix = dataView.matrix;

    if (!matrixDataView ||
        !matrixDataView.columns ||
        !matrixDataView.rows ) {
        return
    }
    // ...
}
新しいデータをレンダリングする前に、div 要素の内容を消去します。
public update(options: VisualUpdateOptions) {
    // ...

    // remove old elements
    // to better performance use D3js pattern:
    // https://d3js.org/#enter-exit
    while (this.rowsDiv.firstChild) {
        this.rowsDiv.removeChild(this.rowsDiv.firstChild);
    }
    const prow = document.createElement("p");
    prow.innerText = "Rows";
    this.rowsDiv.appendChild(prow);

    while (this.colsDiv.firstChild) {
        this.colsDiv.removeChild(this.colsDiv.firstChild);
    }
    const pcol = document.createElement("p");
    pcol.innerText = "Columns";
    this.colsDiv.appendChild(pcol);
    // ...
}
マトリックス データ構造をスキャンするための treeWalker 関数を作成します。
public update(options: VisualUpdateOptions) {
    // ...
    const treeWalker = (matrixNode: DataViewMatrixNode, index: number, levels: DataViewHierarchyLevel[], div: HTMLDivElement)  => {

    }
    // ...
}
ここで、matrixNode は現在のノードであり、levels はこの階層レベルのメタデータ列であり、div は子 HTML 要素の親要素です。
treeWalker は再帰関数であり、ヘッダーとしてのテキストのために div 要素および p を作成し、ノードの子要素の関数を呼び出す必要があります。
public update(options: VisualUpdateOptions) {
    // ...
    const treeWalker = (matrixNode: DataViewMatrixNode, index: number, levels: DataViewHierarchyLevel[], div: HTMLDivElement)  => {
        // ...

        if (matrixNode.children) {
            const childDiv = document.createElement("div");
            childDiv.classList.add("vertical");
            div.appendChild(childDiv);

            const p = document.createElement("p");
            const level = levels[matrixNode.level]; // get current level column metadata from current node
            p.innerText = level.sources[level.sources.length - 1].displayName; // get column name from metadata

            childDiv.appendChild(p); // add paragraph element to div element
            matrixNode.children.forEach((node, index) => treeWalker(node, levels, childDiv, ++levelIndex));
        }
    }
    // ...
}
マトリックスのデータ ビュー構造での列および行のルート要素の関数を呼び出します。
public update(options: VisualUpdateOptions) {
    // ...
    const treeWalker = (matrixNode: DataViewMatrixNode, index: number, levels: DataViewHierarchyLevel[], div: HTMLDivElement)  => {
        // ...
    }
    // ...
    // remove old elements
    // ...

    // ...
    const rowRoot: DataViewMatrixNode = matrixDataView.rows.root;
    rowRoot.children.forEach((node) => treeWalker(node, matrixDataView.rows.levels, this.rowsDiv));

    const colRoot = matrixDataView.columns.root;
    colRoot.children.forEach((node) => treeWalker(node, matrixDataView.columns.levels, this.colsDiv));
}
ノードの selectionID を生成し、ノードを表示するボタンを作成します。
public update(options: VisualUpdateOptions) {
    // ...
    const treeWalker = (matrixNode: DataViewMatrixNode, index: number, levels: DataViewHierarchyLevel[], div: HTMLDivElement)  => {
        const selectionID: ISelectionID = this.host.createSelectionIdBuilder()
            .withMatrixNode(matrixNode, levels)
            .createSelectionId();

        let nodeBlock = document.createElement("button");
        nodeBlock.innerText = matrixNode.value.toString();

        nodeBlock.addEventListener("click", (event) => {
            // call select method in the selection manager
            this.selectionManager.select(selectionID);
        });

        nodeBlock.addEventListener("contextmenu", (event) => {
            // call showContextMenu method to display context menu on the visual
            this.selectionManager.showContextMenu(selectionID, {
                x: event.clientX,
                y: event.clientY
            });
            event.preventDefault();
        });
        // ...
    }
    // ...
}
強調表示の主な手順は、値の別の配列を作成することです。
ターミナル ノードのオブジェクトには、values 配列の 2 つのプロパティ、value と highlight があります。
JSON.stringify(options.dataViews[0].matrix.rows.root.children[0].children[0].children[0], null, " ");
{
 "level": 2,
 "levelValues": [
  {
   "value": "R233",
   "levelSourceIndex": 0
  }
 ],
 "value": "R233",
 "identity": {
  "identityIndex": 2
 },
 "values": {
  "0": {
   "value": null,
   "highlight": null
  },
  "1": {
   "value": 19,
   "highlight": 19
  }
 }
}
この value は他の視覚化からの選択を適用しないノードの値を表し、highlight はデータのどの部分が強調表示されたかを示します。
Note
highlight の値が value の値より小さい場合、value は部分的に強調表示されました。
ノードの values 配列が表示されている場合は、それを処理するコードを追加します。
public update(options: VisualUpdateOptions) {
    // ...
    const treeWalker = (matrixNode: DataViewMatrixNode, index: number, levels: DataViewHierarchyLevel[], div: HTMLDivElement)  => {
        // ...

        if (matrixNode.values) {
            const sumOfValues = Object.keys(matrixNode.values) // get key property of object (value are 0 to N)
                .map(key => +matrixNode.values[key].value) // convert key property to number
                .reduce((prev, curr) => prev + curr) // sum of values

            let sumOfHighlights = sumOfValues;
            sumOfHighlights = Object.keys(matrixNode.values) // get key property of object (value are 0 to N)
                .map(key => matrixNode.values[key].highlight ? +matrixNode.values[key].highlight : null ) // convert key property to number if it exists
                .reduce((prev, curr) => curr ? prev + curr : null) // convert key property to number

            // create div container for value and highlighted value
            const vals = document.createElement("div");
            vals.classList.add("vertical")
            vals.classList.replace("vertical", "horizontal");
            // create paragraph element for label
            const highlighted = document.createElement("p");
            // Display complete value and highlighted value
            highlighted.innerText = `${sumOfHighlights}/${sumOfValues}`;

            // create div container for value
            const valueDiv = document.createElement("div");
            valueDiv.style.width = sumOfValues * 10 + "px";
            valueDiv.classList.add("value");

            // create div container for highlighted values
            const highlightsDiv = document.createElement("div");
            highlightsDiv.style.width = sumOfHighlights * 10 + "px";
            highlightsDiv.classList.add("highlight");
            valueDiv.appendChild(highlightsDiv);

            // append button and paragraph to div containers to parent div
            vals.appendChild(nodeBlock);
            vals.appendChild(valueDiv);
            vals.appendChild(highlighted);
            div.appendChild(vals);
        } else {
            div.appendChild(nodeBlock);
        }

        if (matrixNode.children) {
            // ...
        }
    }
    // ...
}
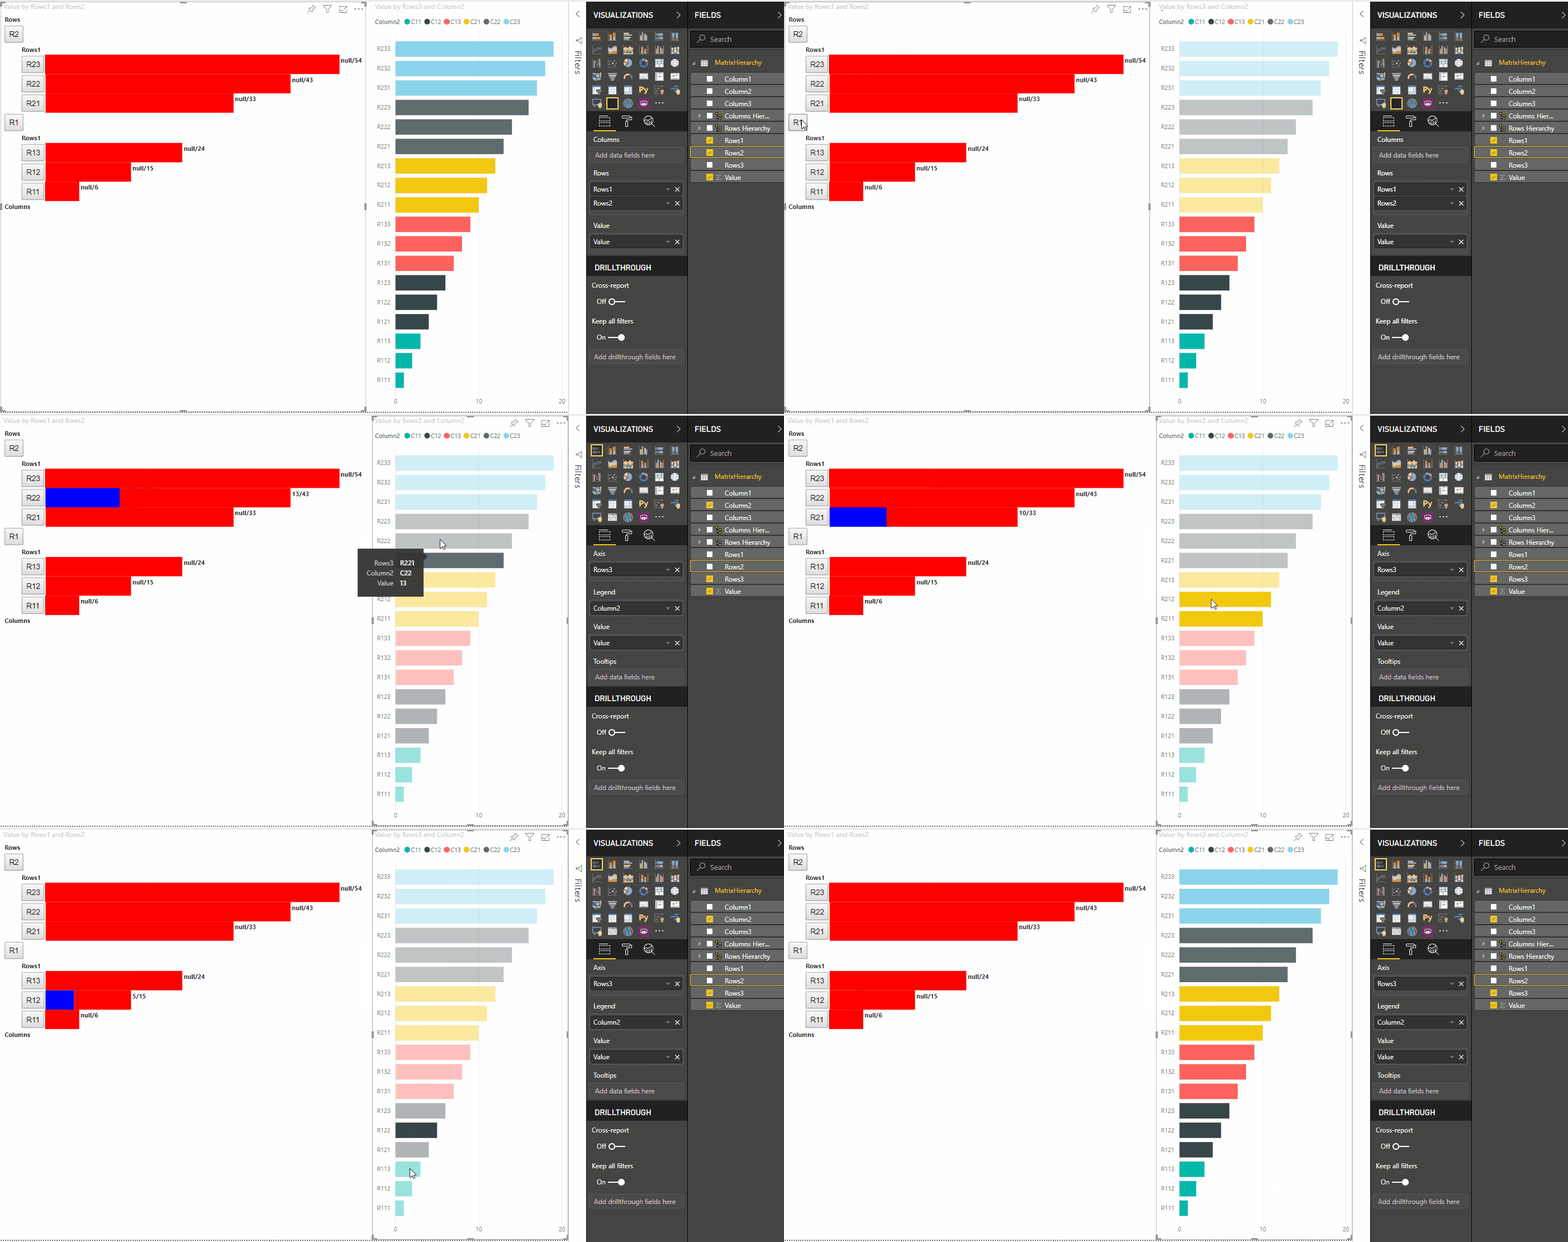
結果として、ボタンと値を持つ視覚化が生成されます (highlighted value/default value など)。


