チュートリアル: アップリフトモデルを作成、トレーニング、および評価する
このチュートリアルでは、Microsoft Fabric での Synapse Data Science ワークフローのエンド ツー エンドの例を示します。 高揚モデルを作成、トレーニング、評価し、高揚モデリング手法を適用する方法について説明します。
前提 条件
Microsoft Fabric サブスクリプションを取得します。 または、無料の Microsoft Fabric 試用版にサインアップします。
Microsoft Fabric にサインインします。
ホーム ページの左下にあるエクスペリエンス スイッチャーを使用して、Fabric に切り替えます。

- Microsoft Fabric ノートブックに関する知識
- このノートブックのために、この例でのデータを格納するレイクハウス。 詳細については、「ノートブック にレイクハウスを追加する」を参照してください。
ノートブックで作業を進める
ノートブックでは次の 2 つの方法のいずれかで作業を進めることができます。
- 組み込みのノートブックを開いて実行します。
- GitHub からノートブックをアップロードします。
組み込みのノートブックを開く
このチュートリアルには、Uplift モデリングのサンプル とノートブック が含まれています。
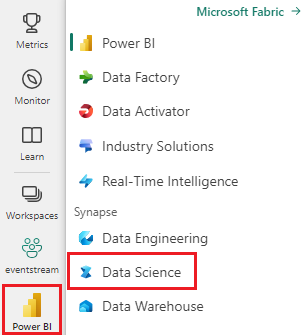
このチュートリアルのサンプルノートブックを開くには、「データサイエンスチュートリアル用にシステムを準備する」の手順に従ってください。。
コードの実行を開始する前に、必ずレイクハウスをノートブックにアタッチしてください。
GitHub からノートブックをインポートする
このチュートリアルには、AIsample - Uplift Modeling.ipynb ノートブックが付属しています。
このチュートリアルの付属のノートブックを開くには、「データ サイエンスチュートリアル用にシステムを準備する」の手順に従って、ノートブックをワークスペースにインポートします。
このページからコードをコピーして貼り付ける場合は、新しいノートブックを作成することができます。
コードを実行し始める前に、必ずノートブック にレイクハウス を接続してください。
手順 1: データを読み込む
データセット
Criteo AI Lab によってデータセットが作成されました。 そのデータセットには 1300 万行があります。 各行は 1 人のユーザーを表します。 各行には、12 個の特徴、治療インジケーター、および訪問と変換を含む 2 つのバイナリ ラベルがあります。
- f0 - f11: 特徴値 (高密度、浮動値)
- 治療: ユーザーがランダムに治療対象であったかどうか (広告など) (1 = 治療、0 = 制御)
- 変換: ユーザー (バイナリ、ラベル) に対して変換が行われたかどうか (購入など)
- アクセス: ユーザーがコンバージョン(例えば、購入)を行ったかどうか(バイナリ、ラベル)
引用
- データセットのホーム ページ: https://ailab.criteo.com/criteo-uplift-prediction-dataset/
このノートブックに使用されるデータセットには、次の BibTex 引用が必要です。
@inproceedings{Diemert2018,
author = {{Diemert Eustache, Betlei Artem} and Renaudin, Christophe and Massih-Reza, Amini},
title={A Large Scale Benchmark for Uplift Modeling},
publisher = {ACM},
booktitle = {Proceedings of the AdKDD and TargetAd Workshop, KDD, London,United Kingdom, August, 20, 2018},
year = {2018}
}
ヒント
次のパラメーターを定義することで、このノートブックをさまざまなデータセットに簡単に適用できます。
IS_CUSTOM_DATA = False  # If True, the user must upload the dataset manually
DATA_FOLDER = "Files/uplift-modelling"
DATA_FILE = "criteo-research-uplift-v2.1.csv"

# Data schema
FEATURE_COLUMNS = [f"f{i}" for i in range(12)]
TREATMENT_COLUMN = "treatment"
LABEL_COLUMN = "visit"

EXPERIMENT_NAME = "aisample-upliftmodelling"  # MLflow experiment name
ライブラリのインポート
処理する前に、必要な Spark ライブラリと SynapseML ライブラリをインポートする必要があります。 また、データ視覚化ライブラリ (Seaborn、Python データ視覚化ライブラリなど) もインポートする必要があります。 データ視覚化ライブラリには、DataFrames と配列にビジュアル リソースを構築するための高度なインターフェイスが用意されています。 Spark、SynapseML、および Seabornについて詳しく説明します。
import os
import gzip

import pyspark.sql.functions as F
from pyspark.sql.window import Window
from pyspark.sql.types import *

import numpy as np
import pandas as pd

import matplotlib as mpl
import matplotlib.pyplot as plt
import matplotlib.style as style
import seaborn as sns

%matplotlib inline

from synapse.ml.featurize import Featurize
from synapse.ml.core.spark import FluentAPI
from synapse.ml.lightgbm import *
from synapse.ml.train import ComputeModelStatistics

import mlflow
データセットをダウンロードして lakehouse にアップロードする
このコードは、一般公開されているバージョンのデータセットをダウンロードし、そのデータ リソースを Fabric Lakehouse に格納します。
重要
ノートブックを実行する前に、必ずレイクハウスを追加してください。 これを行わないと、エラーが発生します。
if not IS_CUSTOM_DATA:
    # Download demo data files into lakehouse if not exist
    import os, requests

    remote_url = "http://go.criteo.net/criteo-research-uplift-v2.1.csv.gz"
    download_file = "criteo-research-uplift-v2.1.csv.gz"
    download_path = f"/lakehouse/default/{DATA_FOLDER}/raw"

    if not os.path.exists("/lakehouse/default"):
        raise FileNotFoundError("Default lakehouse not found, please add a lakehouse and restart the session.")
    os.makedirs(download_path, exist_ok=True)
    if not os.path.exists(f"{download_path}/{DATA_FILE}"):
        r = requests.get(f"{remote_url}", timeout=30)
        with open(f"{download_path}/{download_file}", "wb") as f:
            f.write(r.content)
        with gzip.open(f"{download_path}/{download_file}", "rb") as fin:
            with open(f"{download_path}/{DATA_FILE}", "wb") as fout:
                fout.write(fin.read())
    print("Downloaded demo data files into lakehouse.")
このノートブックのランタイムの記録を開始します。
# Record the notebook running time
import time

ts = time.time()
MLflow 実験の追跡を設定する
MLflow ログ機能を拡張するために、自動ログは、トレーニング中に機械学習モデルの入力パラメーターと出力メトリックの値を自動的にキャプチャします。 その後、この情報がワークスペースに記録され、MLflow API またはワークスペース内の対応する実験からアクセスして視覚化できます。 自動ログ記録の詳細については、このリソースを参照してください。
# Set up the MLflow experiment
import mlflow

mlflow.set_experiment(EXPERIMENT_NAME)
mlflow.autolog(disable=True)  # Disable MLflow autologging
手記
ノートブック セッションで Microsoft Fabric の自動ログ記録を無効にするには、mlflow.autolog() を呼び出して disable=True設定します。
レイクハウスからデータを読み取る
レイクハウスの [ファイル] セクションから生データを読み取り、さまざまな日付部分の列をさらに追加します。 パーティション分割されたデルタ テーブルの作成にも同じ情報が使用されます。
raw_df = spark.read.csv(f"{DATA_FOLDER}/raw/{DATA_FILE}", header=True, inferSchema=True).cache()
手順 2: 探索的データ分析
display コマンドを使用して、データセットに関する高度な統計情報を表示します。 グラフ ビューを表示して、データセットのサブセットを簡単に視覚化することもできます。
display(raw_df.limit(20))
アクセスするユーザーの割合、変換するユーザーの割合、および変換する訪問者の割合を調べます。
raw_df.select(
    F.mean("visit").alias("Percentage of users that visit"),
    F.mean("conversion").alias("Percentage of users that convert"),
    (F.sum("conversion") / F.sum("visit")).alias("Percentage of visitors that convert"),
).show()
分析は、治療グループのユーザー (治療を受けたユーザー、または広告) の 4.9% がオンライン ストアを訪問したことを示しています。 コントロール グループ 3.8% のユーザー (治療を受けなかったユーザー、または広告に対して提供または公開されなかったユーザー) のみが同じ操作を行いました。 さらに、0.31% の治療グループからのすべてのユーザーが変換または購入を行いました。一方、コントロール グループのユーザー 0.19% のみがそうしました。 その結果、治療グループのメンバーであった購入を行った訪問者のコンバージョン率は、6.36%であり、コントロール グループのユーザーに対しては 5.07%** のみと比較されます。 これらの結果に基づいて、この治療は訪問率を約1%向上させ、訪問者のコンバージョン率を約1.3%向上させる可能性があります。 治療は、有意な改善につながります.
手順 3: トレーニング用のモデルを定義する
トレーニングを準備し、データセットをテストする
ここでは、Featurize トランスフォーマーを raw_df DataFrame に適合させ、指定された入力列から特徴を抽出し、それらの特徴を featuresという名前の新しい列に出力します。
結果の DataFrame は、dfという名前の新しい DataFrame に格納されます。
transformer = Featurize().setOutputCol("features").setInputCols(FEATURE_COLUMNS).fit(raw_df)
df = transformer.transform(raw_df)
# Split the DataFrame into training and test sets, with a 80/20 ratio and a seed of 42
train_df, test_df = df.randomSplit([0.8, 0.2], seed=42)

# Print the training and test dataset sizes
print("Size of train dataset: %d" % train_df.count())
print("Size of test dataset: %d" % test_df.count())

# Group the training dataset by the treatment column, and count the number of occurrences of each value
train_df.groupby(TREATMENT_COLUMN).count().show()
処理と制御のデータセットを準備する
トレーニング データセットとテスト データセットを作成した後、機械学習モデルをトレーニングして上昇を測定するために、治療データセットと制御データセットも形成する必要があります。
# Extract the treatment and control DataFrames
treatment_train_df = train_df.where(f"{TREATMENT_COLUMN} > 0")
control_train_df = train_df.where(f"{TREATMENT_COLUMN} = 0")
データを準備したら、LightGBM を使用してモデルのトレーニングに進むことができます。
アップリフトモデル: LightGBM を使用した T-Learner
メタ学習者とは、LightGBM や Xgboost などの機械学習アルゴリズムの上に構築されたアルゴリズムのセットです。それらは条件付き平均治療効果、または CATEを推定するのに役立ちます。 T-learner は、1 つのモデルを使用しないメタ学習者です。 代わりに、T 学習者は治療変数ごとに 1 つのモデルを使用します。 したがって、2つのモデルが開発され、メタ学習者をT学習者と言います。 T 学習者は、複数の機械学習モデルを使用して、治療を完全に放棄する問題を克服します。その場合、学習者はこれを最初に分割する必要があります。
mlflow.autolog(exclusive=False)
classifier = (
    LightGBMClassifier(dataTransferMode="bulk")
    .setFeaturesCol("features")  # Set the column name for features
    .setNumLeaves(10)  # Set the number of leaves in each decision tree
    .setNumIterations(100)  # Set the number of boosting iterations
    .setObjective("binary")  # Set the objective function for binary classification
    .setLabelCol(LABEL_COLUMN)  # Set the column name for the label
)

# Start a new MLflow run with the name "uplift"
active_run = mlflow.start_run(run_name="uplift")

# Start a new nested MLflow run with the name "treatment"
with mlflow.start_run(run_name="treatment", nested=True) as treatment_run:
    treatment_run_id = treatment_run.info.run_id  # Get the ID of the treatment run
    treatment_model = classifier.fit(treatment_train_df)  # Fit the classifier on the treatment training data

# Start a new nested MLflow run with the name "control"
with mlflow.start_run(run_name="control", nested=True) as control_run:
    control_run_id = control_run.info.run_id  # Get the ID of the control run
    control_model = classifier.fit(control_train_df)  # Fit the classifier on the control training data
予測にテスト データセットを使用する
ここでは、前に定義した treatment_model と control_modelを使用して、test_df テスト データセットを変換します。 次に、予測された上昇を計算します。 予測された上昇を、予測された治療結果と予測された制御結果の差として定義します。 この予測された上昇差が大きいほど、個人またはサブグループに対する治療(広告など)の有効性が高くなります。
getPred = F.udf(lambda v: float(v[1]), FloatType())

# Cache the resulting DataFrame for easier access
test_pred_df = (
    test_df.mlTransform(treatment_model)
    .withColumn("treatment_pred", getPred("probability"))
    .drop("rawPrediction", "probability", "prediction")
    .mlTransform(control_model)
    .withColumn("control_pred", getPred("probability"))
    .drop("rawPrediction", "probability", "prediction")
    .withColumn("pred_uplift", F.col("treatment_pred") - F.col("control_pred"))
    .select(TREATMENT_COLUMN, LABEL_COLUMN, "treatment_pred", "control_pred", "pred_uplift")
    .cache()
)

# Display the first twenty rows of the resulting DataFrame
display(test_pred_df.limit(20))
モデルの評価を実行する
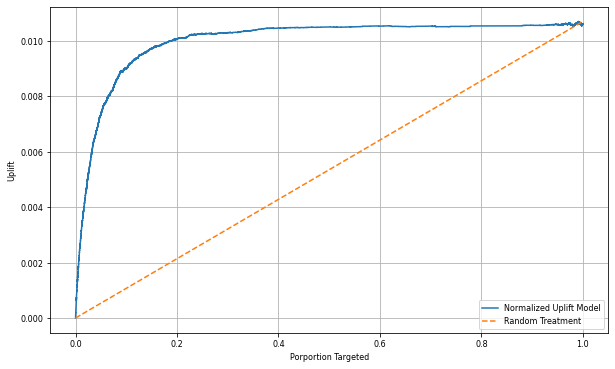
実際の上昇は個人ごとに観察できないため、個人のグループに対する上昇を測定する必要があります。 人口全体にわたる実際の累積的効果をプロットする「アップリフト曲線」を使用します。
x 軸は、治療に選択された母集団の比率を表します。 値が 0 の場合は、治療グループがないことを示しています。誰も治療に触れたり提供したりしません。 値が 1 の場合は、完全な治療群を示唆しています。すべての人が治療を受けるか、あるいはその提供を受けることを示唆しています。 y 軸には、上昇度が表示されます。 目的は、治療グループのサイズ、または治療に対して提供または提示される母集団の割合 (広告など) を見つけることです。 この方法では、結果を最適化するために、ターゲットの選択が最適化されます。
最初に、予測された上昇によってテストデータフレームの順序をランク付けします。 予測された上昇は、予測された治療結果と予測された制御結果の差です。
# Compute the percentage rank of the predicted uplift values in descending order, and display the top twenty rows
test_ranked_df = test_pred_df.withColumn("percent_rank", F.percent_rank().over(Window.orderBy(F.desc("pred_uplift"))))

display(test_ranked_df.limit(20))
次に、治療群と対照群の両方における訪問の累積割合を計算する。
# Calculate the number of control and treatment samples
C = test_ranked_df.where(f"{TREATMENT_COLUMN} == 0").count()
T = test_ranked_df.where(f"{TREATMENT_COLUMN} != 0").count()

# Add columns to the DataFrame to calculate the control and treatment cumulative sum
test_ranked_df = (
    test_ranked_df.withColumn(
        "control_label",
        F.when(F.col(TREATMENT_COLUMN) == 0, F.col(LABEL_COLUMN)).otherwise(0),
    )
    .withColumn(
        "treatment_label",
        F.when(F.col(TREATMENT_COLUMN) != 0, F.col(LABEL_COLUMN)).otherwise(0),
    )
    .withColumn(
        "control_cumsum",
        F.sum("control_label").over(Window.orderBy("percent_rank")) / C,
    )
    .withColumn(
        "treatment_cumsum",
        F.sum("treatment_label").over(Window.orderBy("percent_rank")) / T,
    )
)

# Display the first 20 rows of the dataframe
display(test_ranked_df.limit(20))
最後に、各割合で、治療群と対照群間の訪問の累積パーセンテージの差としてグループの上昇を計算する。
test_ranked_df = test_ranked_df.withColumn("group_uplift", F.col("treatment_cumsum") - F.col("control_cumsum")).cache()
display(test_ranked_df.limit(20))
次に、テスト データセット予測の上昇曲線をプロットします。 プロットする前に、PySpark DataFrame を Pandas DataFrame に変換する必要があります。
def uplift_plot(uplift_df):
    """
    Plot the uplift curve
    """
    gain_x = uplift_df.percent_rank
    gain_y = uplift_df.group_uplift
    # Plot the data
    fig = plt.figure(figsize=(10, 6))
    mpl.rcParams["font.size"] = 8

    ax = plt.plot(gain_x, gain_y, color="#2077B4", label="Normalized Uplift Model")

    plt.plot(
        [0, gain_x.max()],
        [0, gain_y.max()],
        "--",
        color="tab:orange",
        label="Random Treatment",
    )
    plt.legend()
    plt.xlabel("Porportion Targeted")
    plt.ylabel("Uplift")
    plt.grid()

    return fig, ax


test_ranked_pd_df = test_ranked_df.select(["pred_uplift", "percent_rank", "group_uplift"]).toPandas()
fig, ax = uplift_plot(test_ranked_pd_df)

mlflow.log_figure(fig, "UpliftCurve.png")
x 軸は、治療の対象として選択された母集団の比率を表します。 値が 0 の場合は、治療グループがないことを示しています。誰も治療に触れたり提供したりしません。 値が 1 の場合、全員がその治療にさらされるか、または提供される完全な治療グループを意味します。 y 軸は上昇メジャーを示しています。 目的は、治療グループのサイズ、または治療に対して提供または提示される母集団の割合 (広告など) を見つけることです。 この方法では、結果を最適化するために、ターゲットの選択が最適化されます。
最初に、予測された上昇によってテストデータフレームの順序をランク付けします。 予測された上昇は、予測された治療結果と予測された制御結果の差です。
# Compute the percentage rank of the predicted uplift values in descending order, and display the top twenty rows
test_ranked_df = test_pred_df.withColumn("percent_rank", F.percent_rank().over(Window.orderBy(F.desc("pred_uplift"))))

display(test_ranked_df.limit(20))
次に、治療群と対照群の両方における訪問の累積割合を計算する。
# Calculate the number of control and treatment samples
C = test_ranked_df.where(f"{TREATMENT_COLUMN} == 0").count()
T = test_ranked_df.where(f"{TREATMENT_COLUMN} != 0").count()

# Add columns to the DataFrame to calculate the control and treatment cumulative sum
test_ranked_df = (
    test_ranked_df.withColumn(
        "control_label",
        F.when(F.col(TREATMENT_COLUMN) == 0, F.col(LABEL_COLUMN)).otherwise(0),
    )
    .withColumn(
        "treatment_label",
        F.when(F.col(TREATMENT_COLUMN) != 0, F.col(LABEL_COLUMN)).otherwise(0),
    )
    .withColumn(
        "control_cumsum",
        F.sum("control_label").over(Window.orderBy("percent_rank")) / C,
    )
    .withColumn(
        "treatment_cumsum",
        F.sum("treatment_label").over(Window.orderBy("percent_rank")) / T,
    )
)

# Display the first 20 rows of the dataframe
display(test_ranked_df.limit(20))
最後に、各割合で、治療群と対照群間の訪問の累積パーセンテージの差としてグループの上昇を計算する。
test_ranked_df = test_ranked_df.withColumn("group_uplift", F.col("treatment_cumsum") - F.col("control_cumsum")).cache()
display(test_ranked_df.limit(20))
次に、テスト データセット予測の上昇曲線をプロットします。 プロットする前に、PySpark DataFrame を Pandas DataFrame に変換する必要があります。
def uplift_plot(uplift_df):
    """
    Plot the uplift curve
    """
    gain_x = uplift_df.percent_rank
    gain_y = uplift_df.group_uplift
    # Plot the data
    fig = plt.figure(figsize=(10, 6))
    mpl.rcParams["font.size"] = 8

    ax = plt.plot(gain_x, gain_y, color="#2077B4", label="Normalized Uplift Model")

    plt.plot(
        [0, gain_x.max()],
        [0, gain_y.max()],
        "--",
        color="tab:orange",
        label="Random Treatment",
    )
    plt.legend()
    plt.xlabel("Porportion Targeted")
    plt.ylabel("Uplift")
    plt.grid()

    return fig, ax


test_ranked_pd_df = test_ranked_df.select(["pred_uplift", "percent_rank", "group_uplift"]).toPandas()
fig, ax = uplift_plot(test_ranked_pd_df)

mlflow.log_figure(fig, "UpliftCurve.png")
分析および上昇曲線はどちらも、予測によってランク付けされた上位 20% の母集団が、治療を受けた場合に大きな利益を得られることを示しています。 これは、母集団の上位 20% が、説得可能なグループを表していることを意味します。 そのため、治療グループの目的のサイズのカットオフ スコアを 20%に設定して、最も大きな影響を与える対象の選択顧客を特定できます。
cutoff_percentage = 0.2
cutoff_score = test_ranked_pd_df.iloc[int(len(test_ranked_pd_df) * cutoff_percentage)][
    "pred_uplift"
]

print("Uplift scores that exceed {:.4f} map to Persuadables.".format(cutoff_score))
mlflow.log_metrics(
    {"cutoff_score": cutoff_score, "cutoff_percentage": cutoff_percentage}
)
手順 4: 最終的な ML モデルを登録する
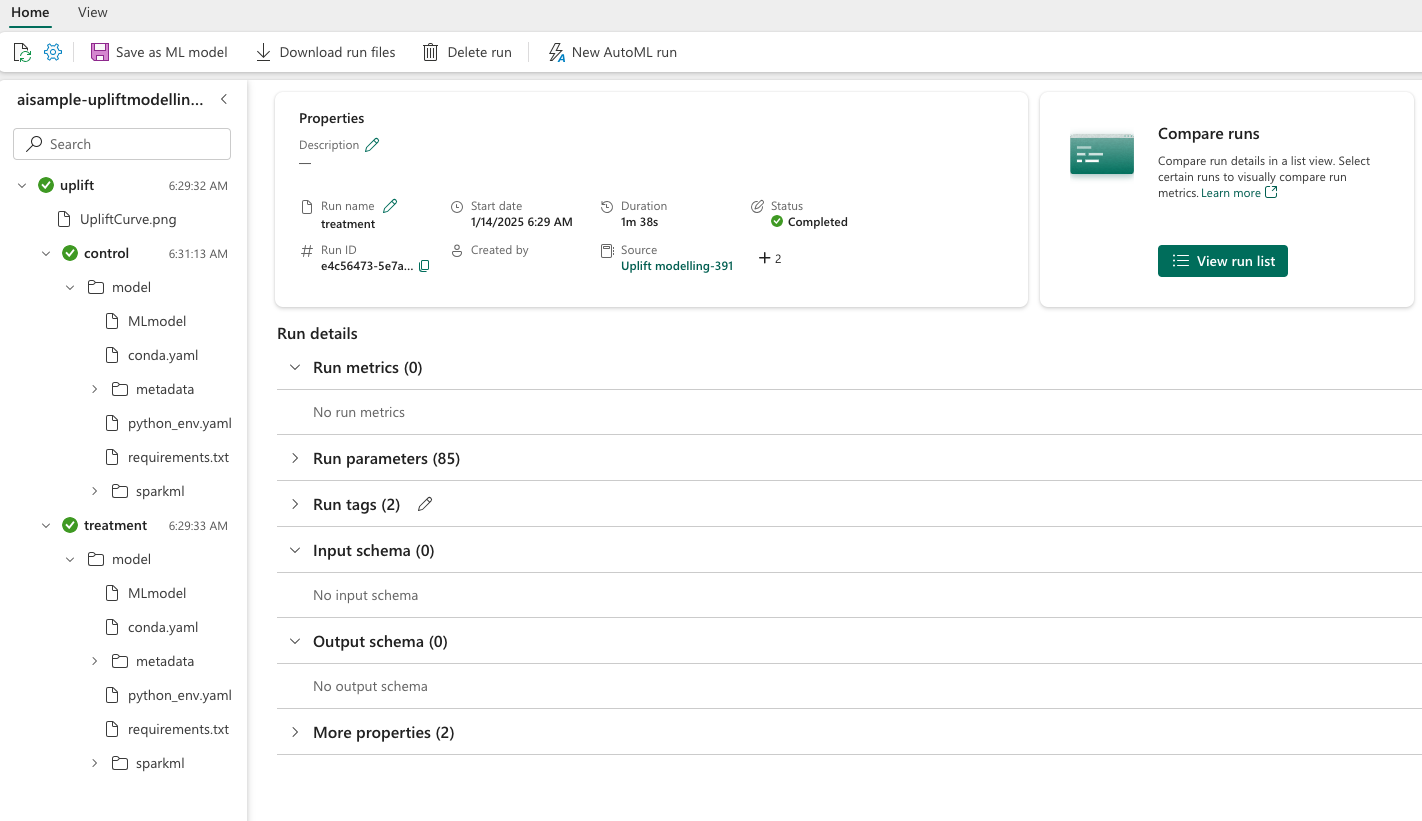
MLflow を使用して、治療グループと制御グループの両方のすべての実験を追跡し、ログに記録します。 この追跡とログ記録には、対応するパラメーター、メトリック、モデルが含まれます。 この情報は、後で使用するために、ワークスペース内の実験名の下に記録されます。
# Register the model
treatment_model_uri = "runs:/{}/model".format(treatment_run_id)
mlflow.register_model(treatment_model_uri, f"{EXPERIMENT_NAME}-treatmentmodel")

control_model_uri = "runs:/{}/model".format(control_run_id)
mlflow.register_model(control_model_uri, f"{EXPERIMENT_NAME}-controlmodel")

mlflow.end_run()
実験を表示するには:
- 左側のパネルで、ワークスペースを選択します。
- 実験名を見つけて選択します。この場合は、aisample-upliftmodellingです。
手順 5: 予測結果を保存する
Microsoft Fabric は PREDICT を提供します。これは、任意のコンピューティング エンジンでバッチ スコアリングをサポートするスケーラブルな関数です。 これにより、お客様は機械学習モデルを運用化できます。 ユーザーは、ノートブックまたは特定のモデルの項目ページから直接バッチ予測を作成できます。 PREDICT の詳細と、Microsoft Fabric で PREDICT を使用する方法については、このリソースを参照してください。
# Load the model back
loaded_treatmentmodel = mlflow.spark.load_model(treatment_model_uri, dfs_tmpdir="Files/spark")
loaded_controlmodel = mlflow.spark.load_model(control_model_uri, dfs_tmpdir="Files/spark")

# Make predictions
batch_predictions_treatment = loaded_treatmentmodel.transform(test_df)
batch_predictions_control = loaded_controlmodel.transform(test_df)
batch_predictions_treatment.show(5)
# Save the predictions in the lakehouse
batch_predictions_treatment.write.format("delta").mode("overwrite").save(
    f"{DATA_FOLDER}/predictions/batch_predictions_treatment"
)
batch_predictions_control.write.format("delta").mode("overwrite").save(
    f"{DATA_FOLDER}/predictions/batch_predictions_control"
)
# Determine the entire runtime
print(f"Full run cost {int(time.time() - ts)} seconds.")
関連コンテンツ
- Microsoft Fabric における の機械学習モデル
- 機械学習モデルのトレーニング
- Microsoft Fabric での 機械学習実験


