Heatmaps features
Heat maps are a great way to analyze user behavior in an aggregated manner. Once you onboard Clarity and land onto Heatmaps, Clarity generates heat maps for popular pages. Select View Heatmap to start using the heatmap. They're created instantly within a matter of seconds.
Heatmaps for a group of pages
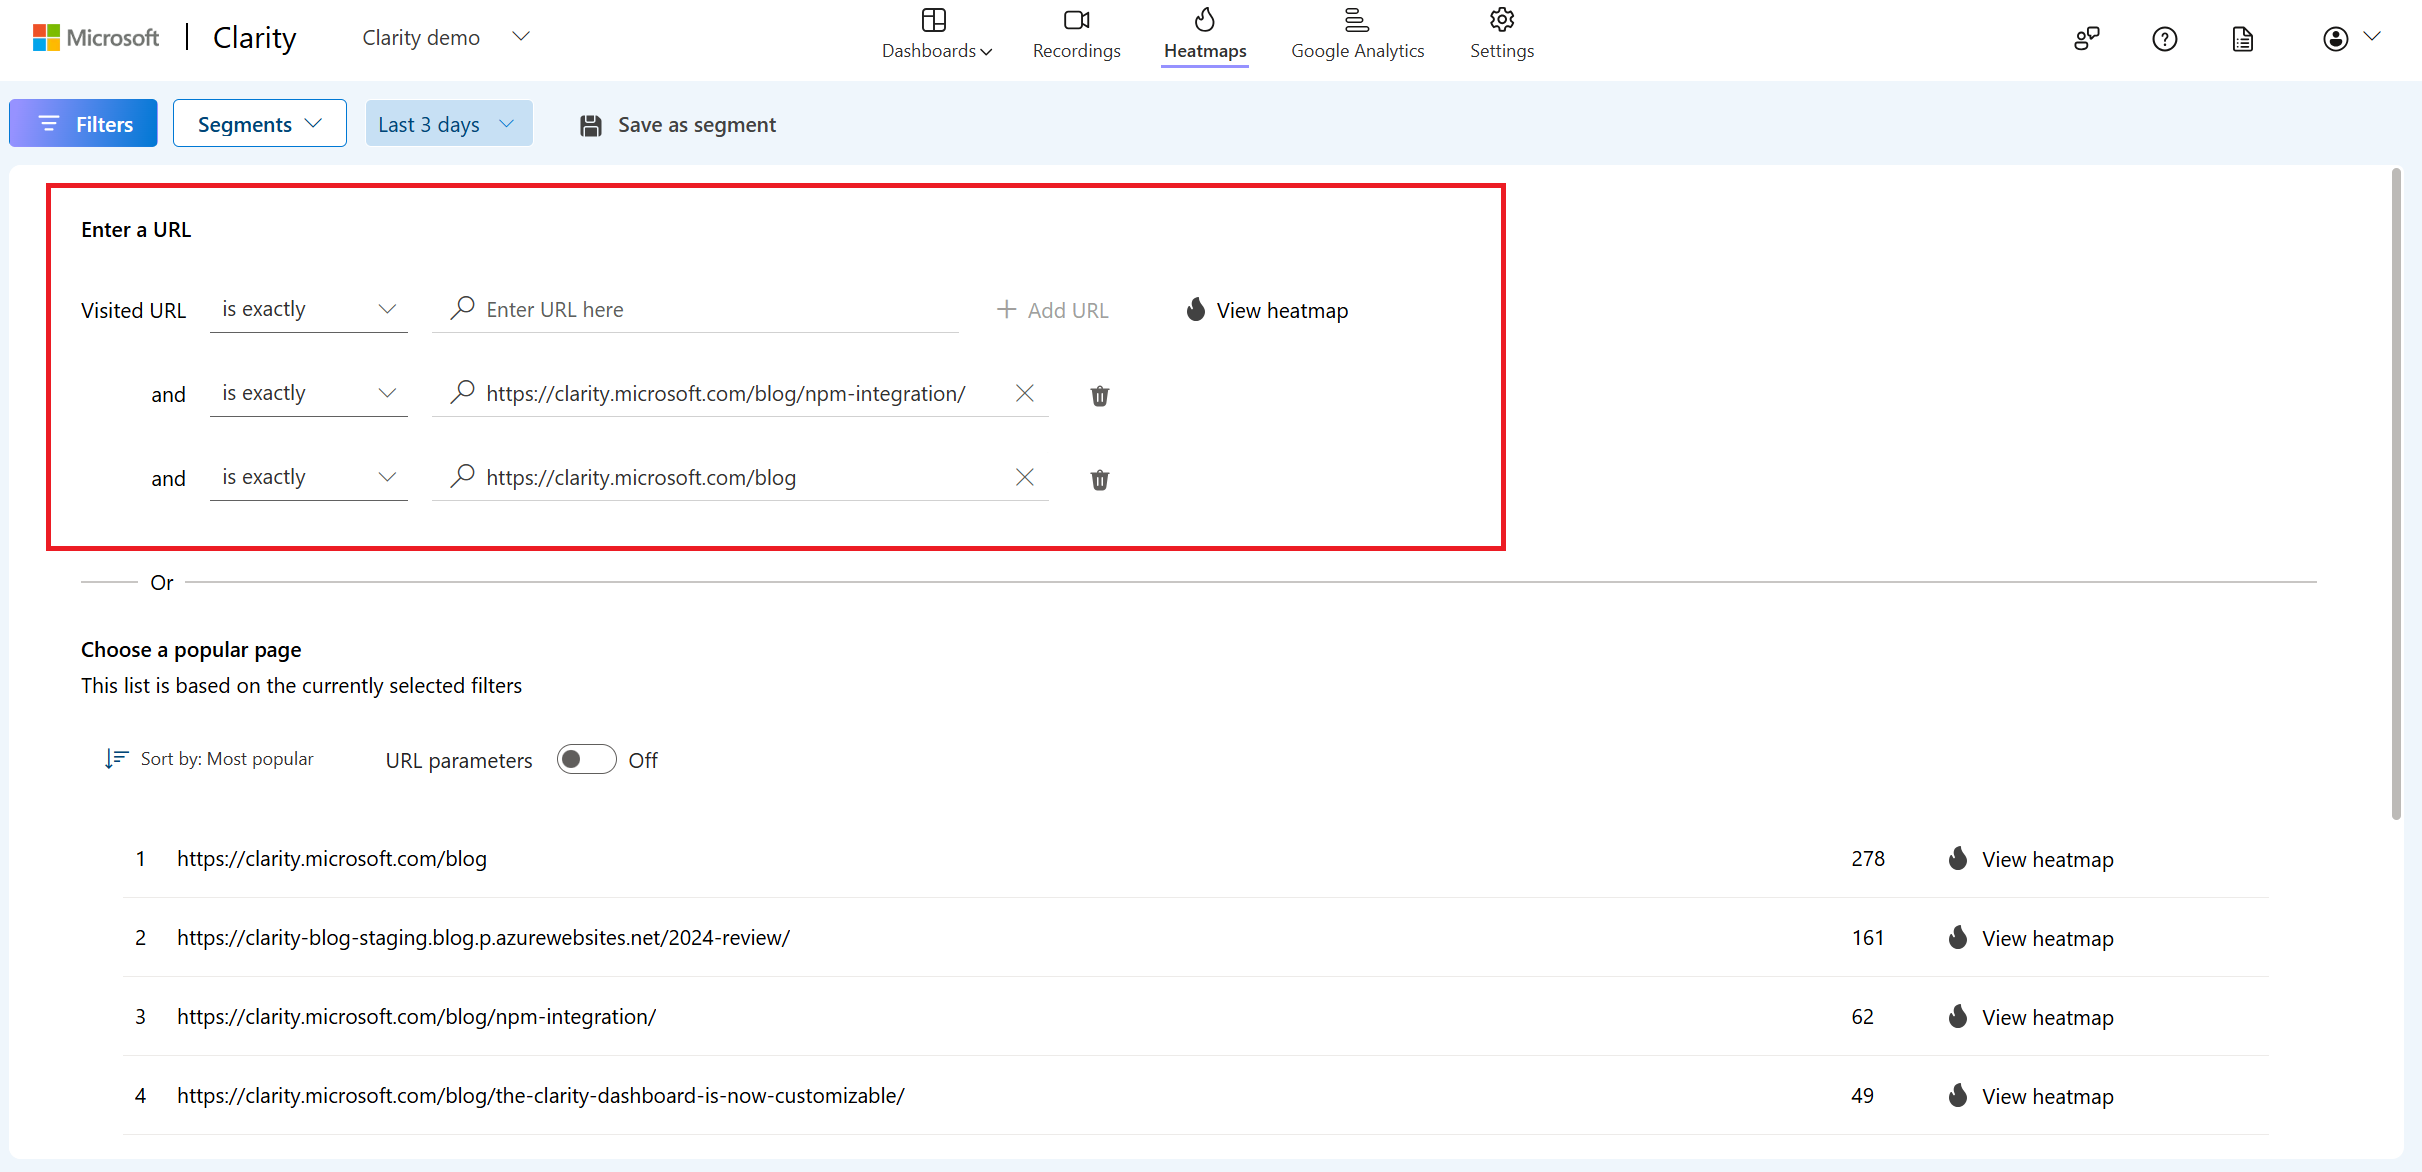
View heatmaps for multiple pages entering a URL and selecting the + Add URL button. Clarity supports various operators to include with the URL. The default operator is is exactly.

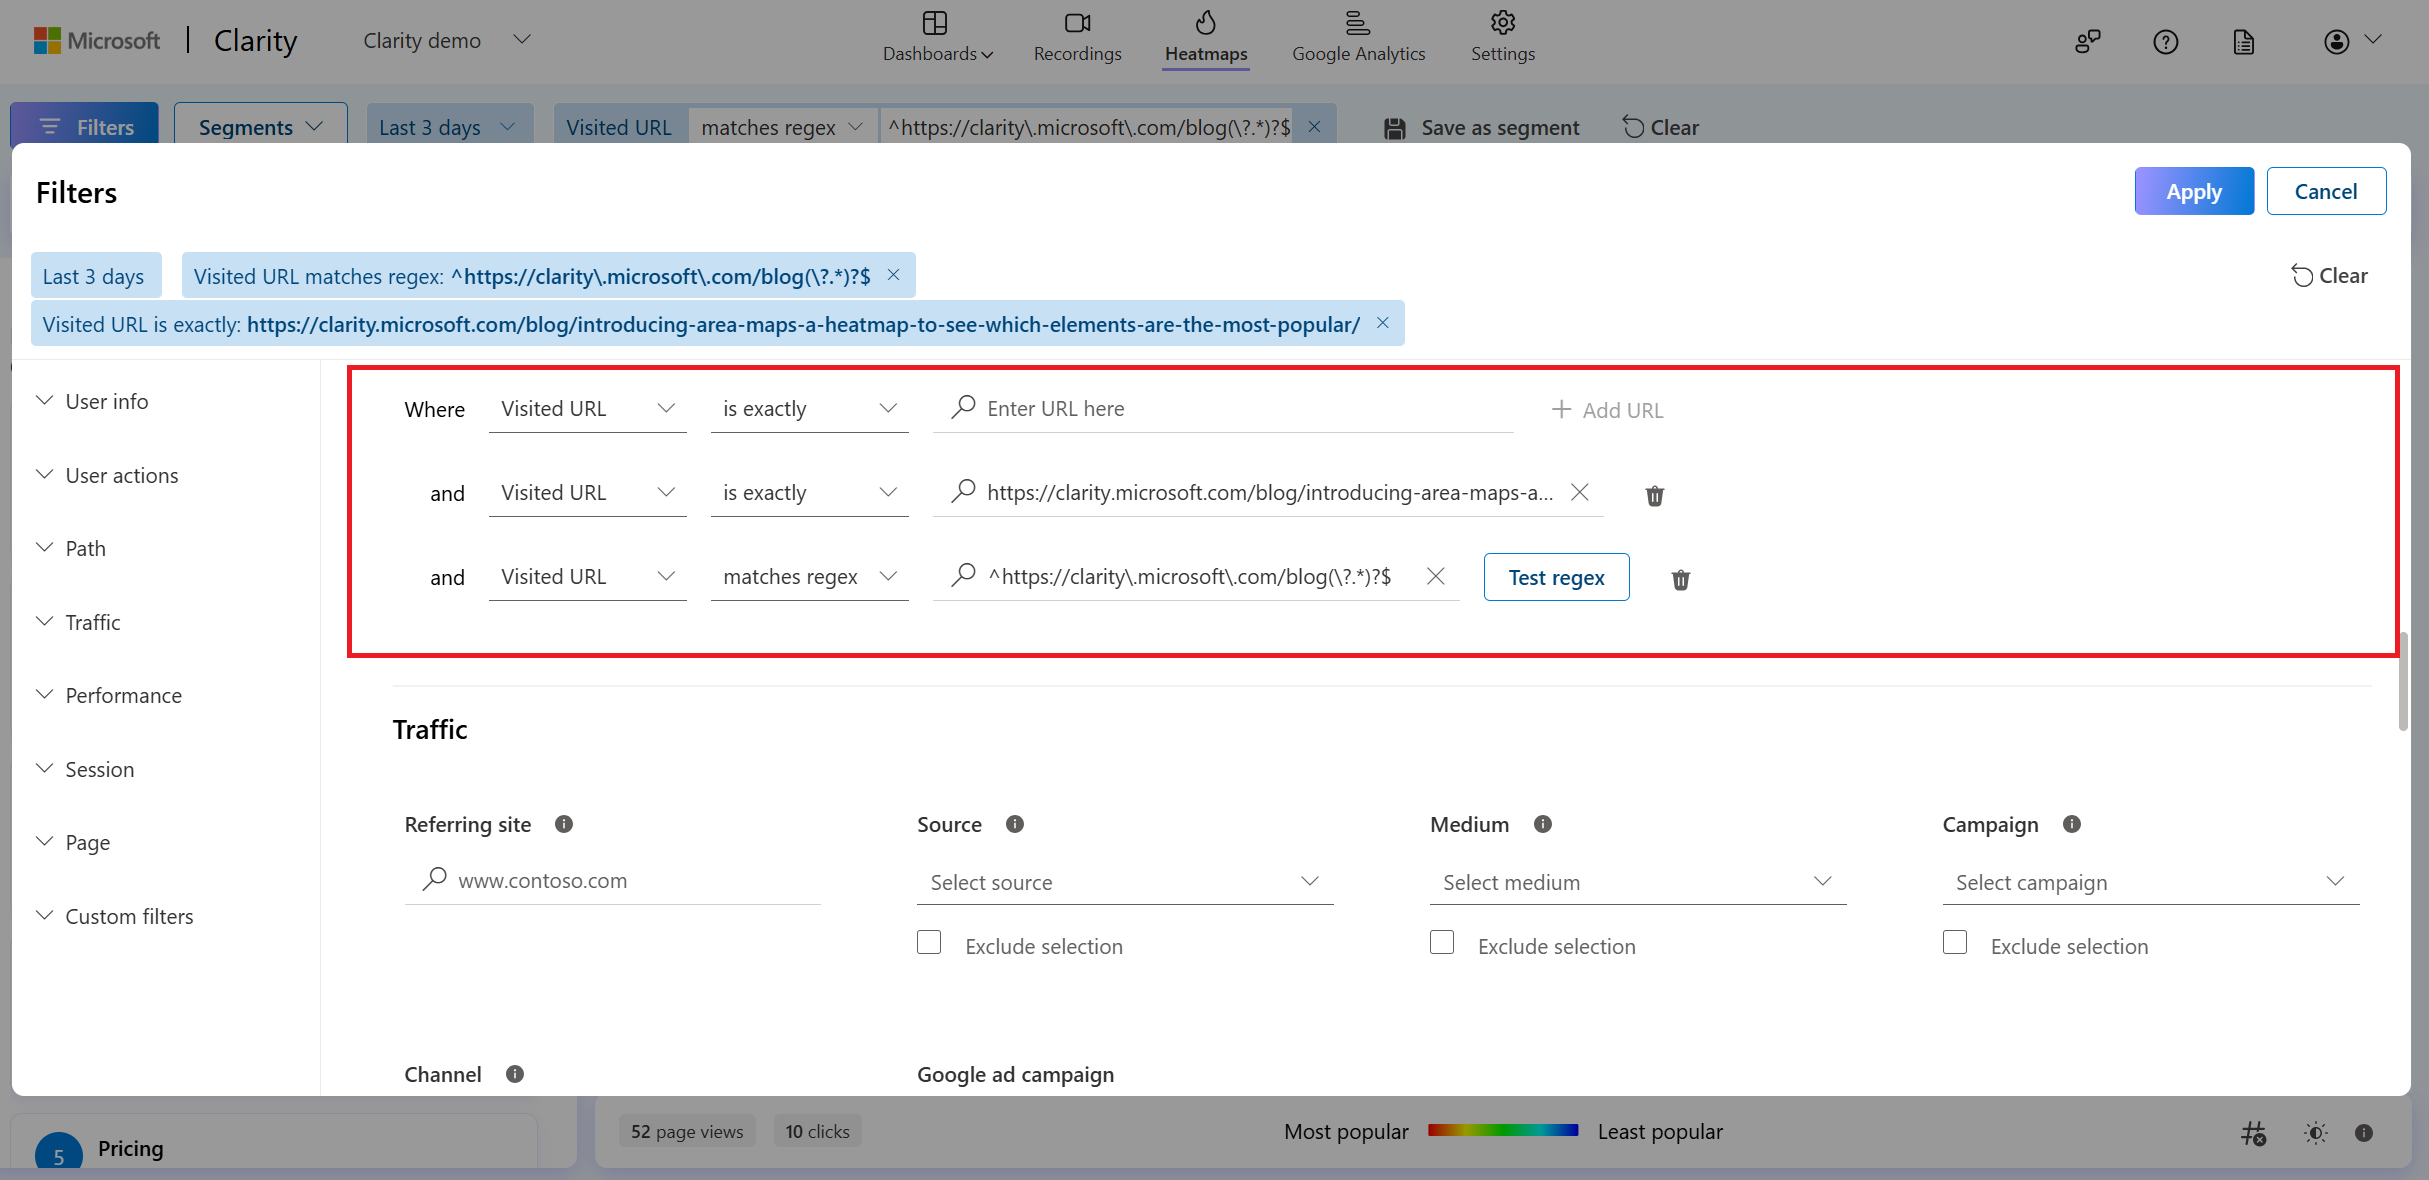
If a visited URL is already selected, you can + Add URL through filters. Learn more on how to use regex tester.

Note
For the default operator, is exactly, heat maps are displayed on the pages that match specified URLs. For example, http://www.contoso.com and https://www.contoso.com are different. The applied filters are combined for all the pages that match the conditions.
Supported filters
Heat maps filters help you sort and customize your visualizations. For more information, see Filters overview.
Segments
To avoid multiple manual typings, you can save groups of filters into segments. Segments can be applied to filters and custom tags. For more information, see Segments.
Important
You can't use GA segments on Heatmaps.
Compare Heatmaps
Use Heatmaps Compare to compare two same or different heatmaps. Learn more here.
Change Screenshots
Select another screenshot to start viewing heat maps.
Heatmaps Insights
Heatmap insights is a Clarity Copilot feature helping you more easily understand the user behaviors and trends of your website pages.
Sharing
Learn how to share Heatmaps either internally with your team or externally outside your team.
Color coding in a Heatmap
Clarity uses color scale representation to understand the user interaction with your website better. The color scale allows you to view your user movement throughout the website.

Red indicates hot areas where users interact more that's most popular.
Blue indicates cold areas where the users interact the least that is least popular.
View Recordings
You can also view the recordings of clicked data to understand and analyze user clicks. Learn more on how to view recordings.
Note
'View recordings' is only available for Click maps.
Opacity
Opacity is only applicable for Click maps.
Download
Learn how to download Heatmaps to save them for further reference or share it across your team.
Heatmaps limitations
- Heat maps are only displayed on the site pages where the Clarity tracking code is installed. Check the Setup process to know how to install it.
- Heat maps data is retained for up to 13 months.
- Heat maps are limited to up to 100,000 page views per heat map.
- Clarity doesn't support capturing screenshots of different dynamic sections, such as a menu that opens as you hover/click. A heat map won't display clicks or scrolls collected over these dynamic elements.
- Clarity uses CSS element selectors to create a heat map and chooses a random playback to overlay the heat map on the top. The page state depends on the playback.
- Clarity scroll maps are built for the
<body>tag. Clarity can't show scroll map inside the<div>container. - Clarity can only render scroll maps for pages with a maximum height of 65,535 pixels.
- You can't use GA segments on Heatmaps.
FAQ
For more answers, refer to Heatmaps FAQ.