コード最適化の結果を表示する
アプリでコード最適化を設定し、構成したら、受け取った分析情報にアクセスして表示します。
コード最適化にアクセスする
コード最適化には、次の 2 つの主要なエントリ ポイントからアクセスできます。
コード最適化の統合された概要ページから (プレビュー)
コード最適化の結果は、コード最適化の概要ページで確認します。 この統合された概要では、複数の Application Insights リソースに関する複数のサブスクリプション全体の結果にアクセスできます。
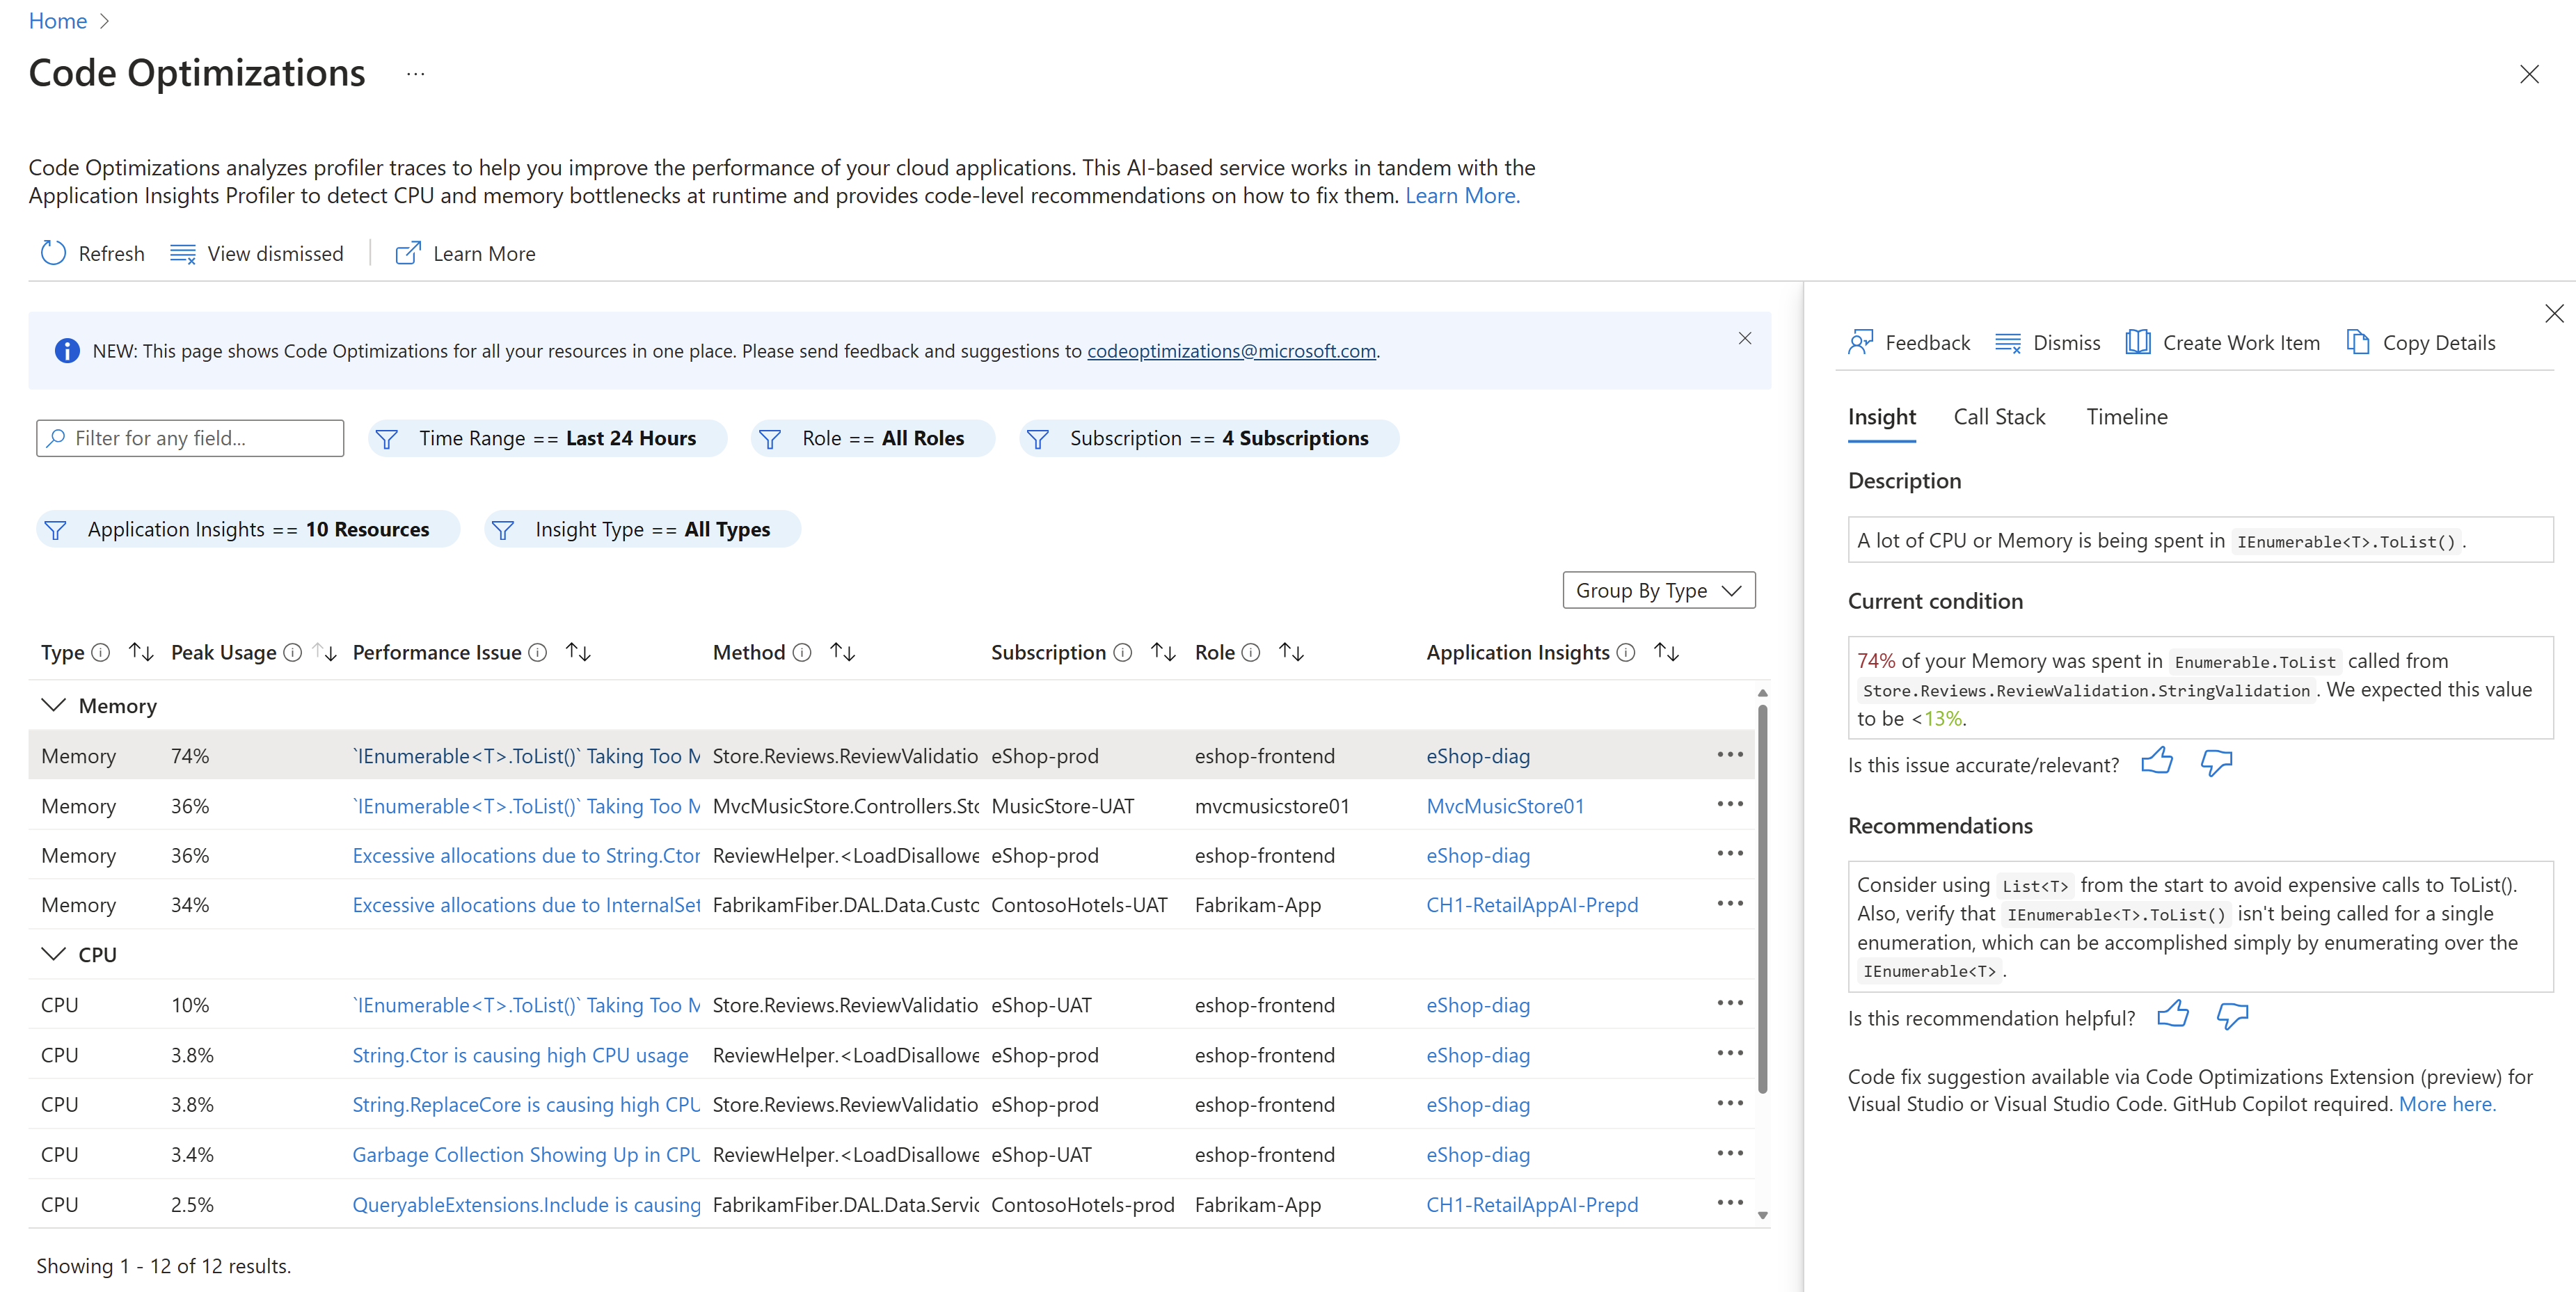
フィルター フィールドを検索するか、次のフィルターを設定することで、統合された結果をフィルター処理できます。
| Assert | 説明 | Default |
|---|---|---|
| 時間範囲 | コード最適化の結果を表示する時間の範囲を選択します。 | 過去 24 時間 |
| ロール | Reporting Services マシンまたはワークロードに割り当てられたロール名。 Application Insights 構成を使用して更新できます。 | すべてのロール |
| サブスクリプション | 分析情報が属するサブスクリプション。 複数のディレクトリを選択できます。 | 該当なし |
| Application Insights | アプリケーションが関連付けられている Application Insights リソース。 複数のディレクトリを選択できます。 | 該当なし |
| 分析情報の種類 | CPU、メモリ、ブロックなど、問題の種類。 | すべての種類 |
次に、次のような方法で、目的のビューに基づいて分析情報結果の列を並べ替えることができます。
- パフォーマンスの問題
- 親メソッドの完全名
個々の Application Insights リソースから
リソースの左側のメニューから、個々の Application Insights リソースに固有のコード最適化にアクセスできます。 [調査]>[パフォーマンス] をクリックし、上部のメニューから [コード最適化] ボタンを選択します。
![[パフォーマンス] ブレードにあるコード最適化のスクリーンショット。](media/code-optimizations/code-optimizations-performance-blade.png)
フィルター フィールドを検索するか、次のフィルターを設定することで、統合された結果をフィルター処理できます。
| Assert | 説明 | Default |
|---|---|---|
| 時間範囲 | コード最適化の結果を表示する時間の範囲を選択します。 | 過去 24 時間 |
| ロール | Reporting Services マシンまたはワークロードに割り当てられたロール名。 Application Insights 構成を使用して更新できます。 | すべてのロール |
| 分析情報の種類 | CPU、メモリ、ブロックなど、問題の種類。 | すべての種類 |
次に、次のような方法で、目的のビューに基づいて分析情報結果の列を並べ替えることができます。
- パフォーマンスの問題
- その問題を含むプロファイルの数
- 親メソッドの完全名
メモリと CPU のピーク使用率の推定値を解釈する
推定 CPU とメモリは、アプリケーション内のアクティビティの量に基づいて判別されます。 メモリと CPU の割合に加えて、コード最適化では以下も含めます。
- 実際の割り当てサイズ (バイト単位)
- その呼び出しで行われた割り当て済みの種類の内訳
[メモリ]
メモリの場合、この数値はトレース内で行われたすべての割り当てに対する割合です。 たとえば、ある問題で 24% のメモリが使用されている場合、その呼び出し内ですべての割り当ての 24% が使用されました。
CPU
CPU の場合、その割合は、マシン内の CPU の数 (4 コア、8 コアなど) とトレース時間に基づいています。 たとえば、トレースの長さが 10 秒で、CPU が 4 個ある場合、合計で 40 秒の CPU 時間となります。 その分析情報に、コード行で CPU の 5% が使用されていることが示されている場合、40 秒の 5%、つまり 2 秒が使用されています。
分析情報の表示
コード最適化の結果を並べ替えてフィルター処理した後、各分析情報を選択して、ペインに次の詳細を表示できます。
- パフォーマンス バグの分析情報の詳細な説明。
- 完全な呼び出し履歴。
- パフォーマンスの問題を修正する方法に関する推奨事項。
- 問題の傾向の影響としきい値のタイムライン。
分析情報
[分析情報] タブの内容:
- 選択した問題の簡単な説明。
- リソース メモリまたは CPU 使用率の現在の状態。
- 問題を修正するための AI によって生成された推奨事項。
Note
分析情報が表示されない場合、コード最適化サービスでは、コードのパフォーマンス ボトルネックが認識されていない可能性があります。 再確認を続け、分析情報がポップアップされるか確認します。
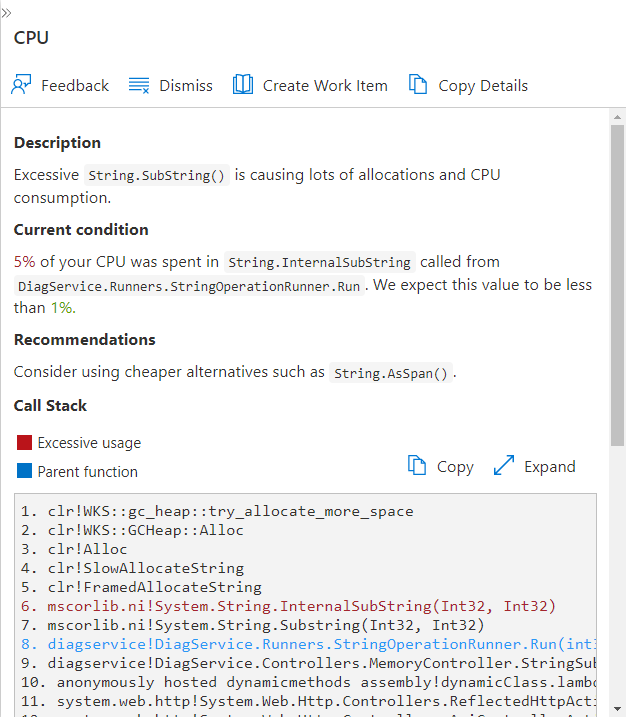
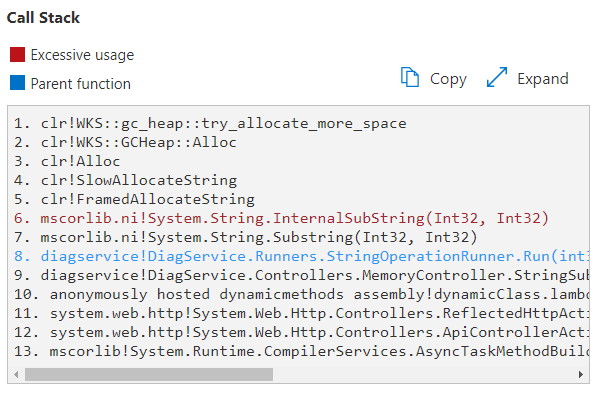
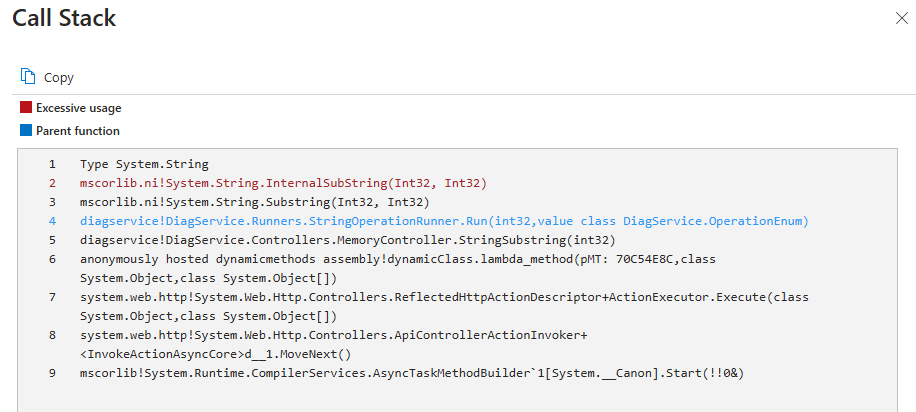
呼び出し履歴
分析情報の詳細ペインの [呼び出し履歴] 見出しの下で、以下を行えます。
- [展開] を選択して、パフォーマンスの問題を取り巻く完全な呼び出し履歴を表示する
- [コピー] を選択して、呼び出し履歴をコピーする。
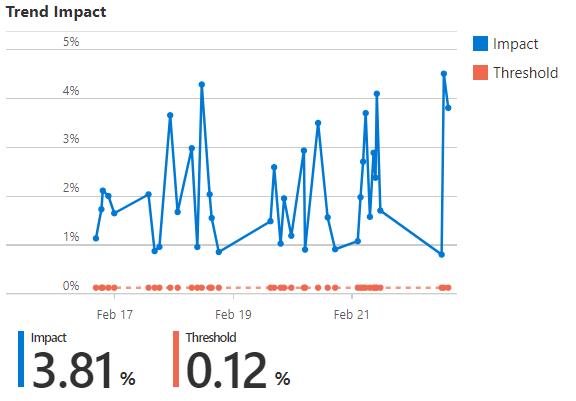
タイムライン
詳細ウィンドウの [タイムライン] で、特定のパフォーマンスに関する問題の影響としきい値のタイムラインを示すグラフを表示することもできます。 結果は、設定したフィルターによって異なります。 たとえば、過去 24 時間に確認されたメモリの "非効率な String.SubString()" パフォーマンス問題の分析情報は次のようになります。