OMS Free Tier Data Consumption Tracker Dashboard
In Operations Management Suite (OMS), there is a Free Tier that allows up to 500 MB of data upload per day for Log Analytics, with 7 days of data retention. For more information on the latest OMS tiers and subscription plans available including their pricings, please visit the Operations Management Suite Pricing site.
This post features a custom OMS Dashboard – the Free Tier Data Consumption Tracker - that extends the Log Analytics Usage records used primarily to drive the Usage Dashboard. It provides a summary view of the data quota consumption relative to the 500 MB daily data upload limit of the OMS Free Tier, calculated in percentage. The .omsview JSON file for the OMS Free Tier Data Consumption Tracker Dashboard can now be downloaded from the TechNet Gallery.


My personal view is that having the Free Tier in OMS is an advantage as it not only allows the end user to try out the services and solutions in OMS for free, it also allow solution developers and service providers to test the waters with their custom solutions and plan their customer POCs without having to deal with the complexities of billing and usage charges up front.
However, if the daily data upload limit for the Free Tier is exceeded, data beyond that limit will not be analysed and records will stop showing up in the OMS Portal. Therefore, this dashboard will be able to provide a clearer picture of the overall data consumption status and whether the daily upload limit of the Free Tier is being stretched or close to being hit when used in an OMS Workspace.
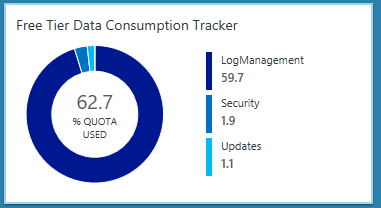
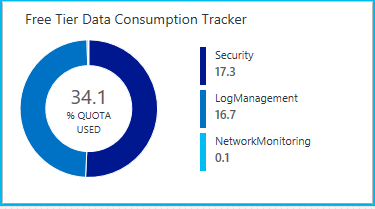
The OMS Free Tier Data Consumption Tracker Dashboard consists of a summary tile on the main page of the OMS Portal that shows how much of the Free Tier daily upload limit has been consumed by all the billable solutions used in the OMS Workspace. The following views are available when drill-in from the summary tile:
- Information View – Provides a summary description for the OMS Free Tier Data Consumption Tracker Dashboard, links to obtain further information and to download the .omsview JSON file for the dashboard.
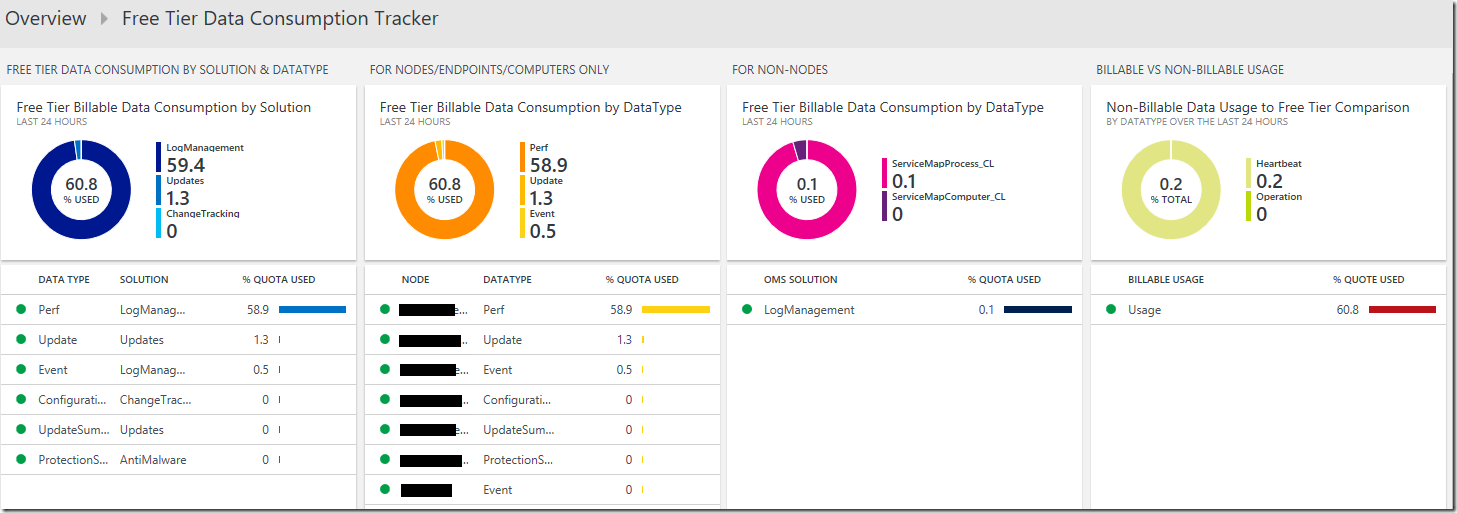
- Free Tier Data Consumption by Solution & DataType View – Provides a last 24-hour summary of the overall Free Tier billable data consumption broken down by Solution on the Donut section, and listing the names of all the OMS DataTypes and their corresponding Solution with the highest Free Tier quota usage, with a monitor that will change state when their % Quota Used exceed thresholds: Above 75=Warning and Above 95=Error, on the List section of the View.
- For Nodes/Endpoints/Computers Only View – Provides a last 24-hour summary of the overall Free Tier billable data consumption caused by Nodes/Endpoints/Computers only, broken down by DataType on the Donut section, and listing the names of all the OMS Nodes/Endpoints/Computersand their corresponding DataType with the highest Free Tier quota usage, with a monitor that will change state when their % Quota Used exceed thresholds: Above 75=Warning and Above 95=Error, on the List section of the View.
- For Non-Nodes View – Provides a last 24-hour summary of the overall Free Tier billable data consumption caused by non-Nodes (records Data not associated with a computernot associated to any Node/Endpoint/Computer), broken down by DataType on the Donut section, and listing the names of all the non-Nodesand their corresponding DataType with the highest Free Tier quota usage, with a monitor that will change state when their % Quota Used exceed thresholds: Above 75=Warning and Above 95=Error, on the List section of the View.
- Billable vs Non-Billable Usage View - Provides a last 24-hour summary of the overall non-billable data usage to the Free Tier comparison, broken down by DataType on the Donut section, and displaying the total billable Free Tier quota usage, with a monitor that will change state when it’s % Quota Used exceeds thresholds: Above 75=Warning and Above 99=Error, on the List section of the View.

To implement the OMS Free Tier Data Consumption Tracker Dashboard to an OMS Workspace, download the .omsview JSON file from the TechNet Gallery and upload the file to the OMS Workspace using the Import option in the View Designer.

Here is the main query that extends the Log Analytics Usage records and is used to drive each of the Views within the Free Tier Data Consumption Tracker Dashboard. It filters the record of Type=Usage, to summarize and display them accordingly:
Type=Usage QuantityUnit="MBytes" IsBillable=true TimeGenerated>NOW-24HOURS | Extend mul(Quantity,0.2) AS UsedFreeTierPercent | measure sum(UsedFreeTierPercent) AS TotalUsedFreeTierPercent by Solution
Additional Resources:
Analyze data usage in Log Analytics by Richard Rundle
/en-us/azure/log-analytics/log-analytics-usage
Get notified if OMS Log Analytics usage is higher than expected by Richard Rundle
https://blogs.technet.microsoft.com/msoms/2016/11/21/get-notified-if-oms-log-analytics-usage-is-higher-than-expected/
Arithmetic operations meet aggregate queries in OMS by Leyla Kazemi
https://blogs.technet.microsoft.com/msoms/2016/09/13/arithmetic-operations-meet-aggregate-queries-in-oms/
Disclaimer:
All information on this blog is provided on an as-is basis with no warranties and for informational purposes only. Use at your own risk. The opinions and views expressed in this blog are those of the author and do not necessarily state or reflect those of my employer.
Comments
- Anonymous
March 22, 2017
Great work Wei! - Anonymous
March 24, 2017
Hey Wei don't add the solution to the github azure quickstart repo, if you need an hand I can help.Daniele