Monitoring OMS Direct Agents in an OpsMgr Management Group
This post demonstrates how the Blue Bar State Widget Template (Download Here) can be used to create a custom dashboard in the OpsMgr 2012 Operations Console to display a list of Microsoft Monitoring Agents that are directly connecting to one or multiple OMS Workspaces, and providing further details on the agent version, OMS Workspace ID and total send queue size for each of these agents within an OpsMgr 2012 or 2016 Management Group. This allows the user to visually identify which agents are communicating to one or multiple OMS Workspaces and to compare the data flow from the agents to the cloud service based on their Total Send Queue Size per OMS Workspace (over the last 6 hours) on the column with the blue bar.
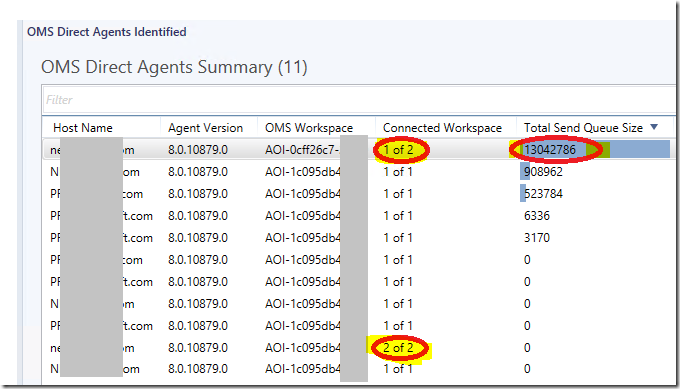
For more information about the Direct Agent for OMS, please refer to the following blog post by Graham Davies:
https://blogs.technet.microsoft.com/msoms/2016/08/17/the-many-faces-of-the-microsoft-monitoring-agent/

One of the ways to find out which management groups and OMS Workspaces a Microsoft Monitoring Agent is communicating (multi-homed) to is via its performance counters under the Health Service Management Groups category.
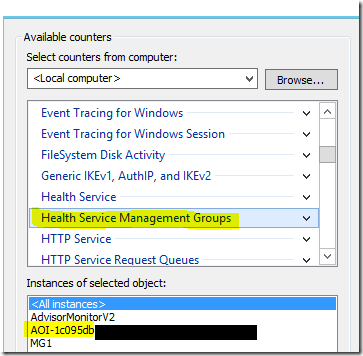
Hence, to locate and track the data flow of agents in an OpsMgr management group that are directly attached to one or multiple OMS Workspaces, create a performance collection rule based on the Performance Collection Rule type in the Authoring workspace of the Operations Console. Target the performance collection rule at the Health Service class and specify to collect from the following performance counter, as shown in the Figure 1a and 1b:
- Collection Rule Name: Collect Send Queue Size Data from All Managed Windows Agent
- Object: Health Service Management Groups
- Counter: Send Queue Size
- Check the checkbox to include all instances for the selected counter
Important Note: Depending on the number of agents managed, setting the collection rule to collect at an interval that is too frequent from all the agent hosts within a management group may cause an increase in free space consumption in the Operational and the Data Warehouse Databases. Hence the frequency for the collection rule and the target group of Health Services will need to be considered before turning on the collection rule.
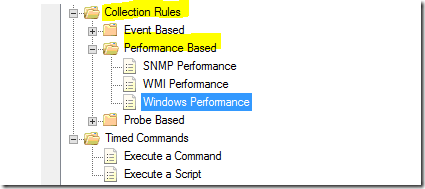
Figure 1a
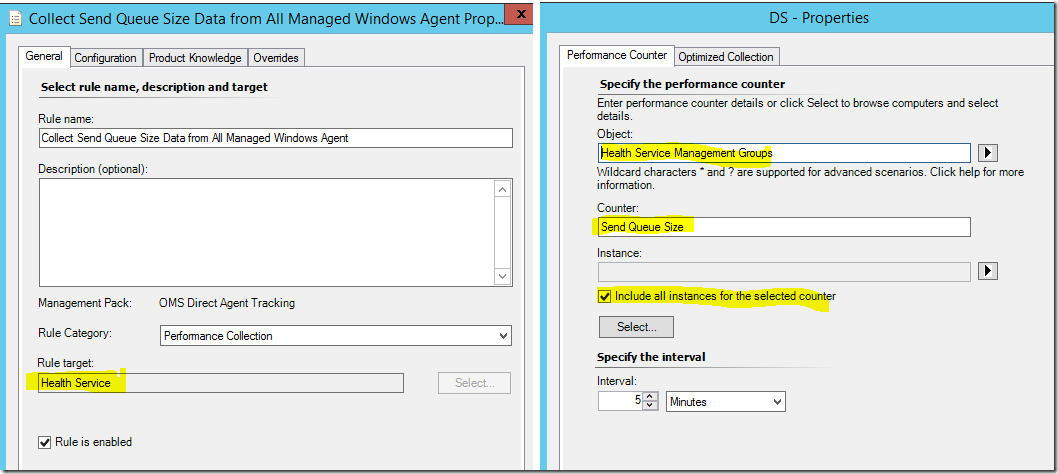
Figure 1b
If configured correctly, the performance data for each of the instance listed under the Health Service Management Groups\Send Queue Size performance counter within each of the Microsoft Monitoring Agents involved will be collected by the collection rule above and can be viewed from the Performance View of a selected Health Service object as follows:
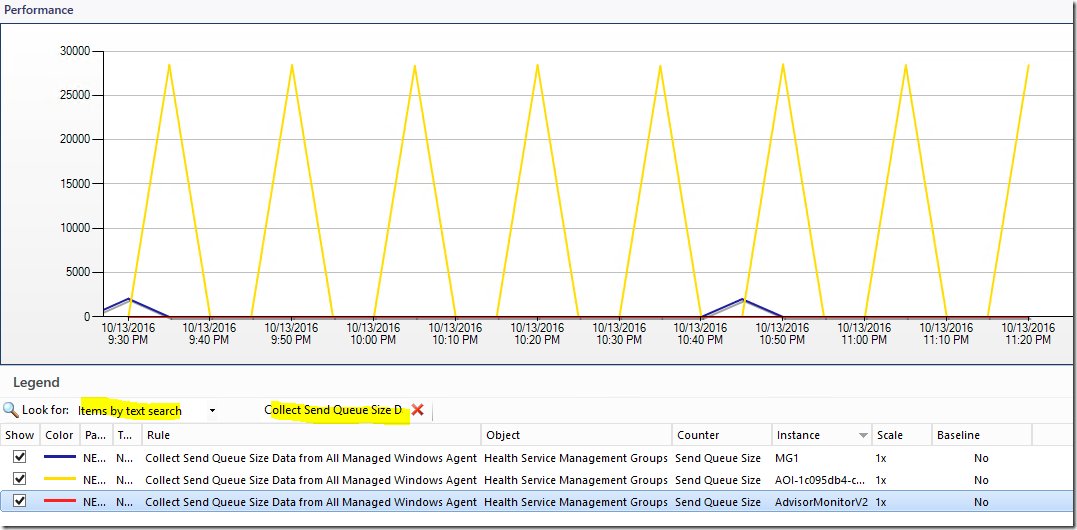
If an OpsMgr Agent is also an OMS Direct Agent, the Send Queue Size performance data of it’s instances prefixed with “AOI-“ will be detected and collected by the custom collection rule defined above, where the GUID after AOI- should be the OMS Workspace ID for a Direct Agent.
Note that the AdvisorMonitorV2 instance found in the performance counters under Health Service Management Groups category should be from the old advisor functionality that has been deprecated.
To create an instance of the dashboard shown above using the Blue Bar State Widget Template, first, create a dashboard layout with 1 cell, Click to add widget on a cell, then select the Sample Blue Bar State Widget template located under the “All Templates/WeiOutThere Blue Bar Column Template” folder , go through the UI pages of the template and enter the required information.

Here is a sample PowerShell script that can be inserted into the “PowerShell Script” page of the widget template to create a Blue Bar State Widget that consist of a list of dummy objects created from the instances of the performance counters and data collected by the Collect Send Queue Size Data from All Managed Windows Agent collection rule of each agent involved, representing the Microsoft Monitoring Agents that are directly connecting to one or multiple OMS Workspaces and their Total Send Queue Size per OMS Workspace (over the last 6 hours) on the column with the blue bar as well.
 $class = get-scomclass -Name Microsoft.SystemCenter.Agent
#Filter Agents or Health Service Objects that are version 8.0 and above
$Agents = Get-SCOMClassInstance -class $class | where{$_.'[Microsoft.SystemCenter.HealthService].Version'.value -ge 8.0}

$avg_stat = @{}
$dataObjects = @()

#///////// Functions Section ///////////////////// START
function RecalculateMinMaxForAvgStatItem
{
param($name, $value)
$avg_stat[$name]["min"] = ($avg_stat[$name]["min"], $value | Measure -Min).Minimum
$avg_stat[$name]["max"] = ($avg_stat[$name]["max"], $value | Measure -Max).Maximum
}

function CreateStatistics {
param($value)

$stat = $ScriptContext.CreateInstance("xsd://Microsoft.SystemCenter.Visualization.Library!Microsoft.SystemCenter.Visualization.DataProvider/PerformanceDataStatistics")
if ($value -ne $null) {
$stat["AverageValue"] = [double]$value
$stat["Value"] = [double]$value
}
$stat
}

# Initialize Stat Item:
function InitAvgStatItem {
param($name)

if ($avg_stat[$name] -eq $null) {
$avg_stat[$name] = @{}
$avg_stat[$name]["min"] = 0
$avg_stat[$name]["max"] = [Int32]::MinValue
}
}

function AddColumnValue {
param($dataObject, $name, $value)

$v = $value

InitAvgStatItem $name
if ($v -ne $null) {
$dataObject[$name] = CreateStatistics($v)
RecalculateMinMaxForAvgStatItem $name $v
}
else
{
$dataObject[$name] = $null
}
}
#///////// Functions Section ///////////////////// END

#///////// Main Section ///////////////////// START
$iii = 555
foreach ($Agent in $Agents) {
$iii = $iii + 1

#Last 6 hours UTC
$aggregationInterval = 6
$dt = New-TimeSpan -hour $aggregationInterval
$nowlocal = Get-Date

#Convert local time to UTC time
$now = $nowlocal.ToUniversalTime()
$from = $now.Subtract($dt)

#Filter to spefic collection rule and instances with the AOI prefix
$perfRules = $Agent.GetMonitoringPerformanceData() | where-object{$_.CounterName -eq "Send Queue Size" -and $_.RuleDisplayName -eq "Collect Send Queue Size Data from All Managed Windows Agent" -and $_.InstanceName -like "AOI*"}

$workspaceTotal = $perfRules.Count
$workspaceCount = 0

foreach ($perfRule in $perfRules)     {
$workspaceCount = $workspaceCount + 1
#Dummy Object Type
$dataObject = $ScriptContext.CreateInstance("xsd://CustomBlueBar!State/Widget")
$dataObject["Id"]  = [String]$iii

$dataObject["Host Name"]=$Agent.Path
$dataObject["Agent Version"]=$Agent.'[Microsoft.SystemCenter.HealthService].Version'.value
$dataObject["OMS Workspace"] = $perfRule.InstanceName
$dataObject["Connected Workspace"] = [String]$workspaceCount + " of " + [String]$workspaceTotal

$data = $perfRule.GetValues($from, $now) | % { $_.SampleValue } | Measure-Object -Sum

AddColumnValue $dataObject "Total Send Queue Size" $data.Sum


$dataObjects += $dataObject
$iii = $iii + 1

}
}

foreach ($dataObject in $dataObjects)
{
foreach ($metric in $avg_stat.Keys)
{
$stat = $avg_stat[$metric]
$dataObject[$metric]["MinimumValue"] = [double]$stat["min"]

if ($stat["max"] -ne [Int32]::MinValue)
{
$dataObject[$metric]["MaximumValue"] = [double]$stat["max"]
}
else
{
$dataObject[$metric]["MaximumValue"] = [double]0
}
}

$ScriptContext.ReturnCollection.Add($dataObject)
}
On the “Refresh Interval” page, enter a numerical value for the refresh interval of the widget (in seconds), then click the Finish button to create the custom Blue Bar State Widget.
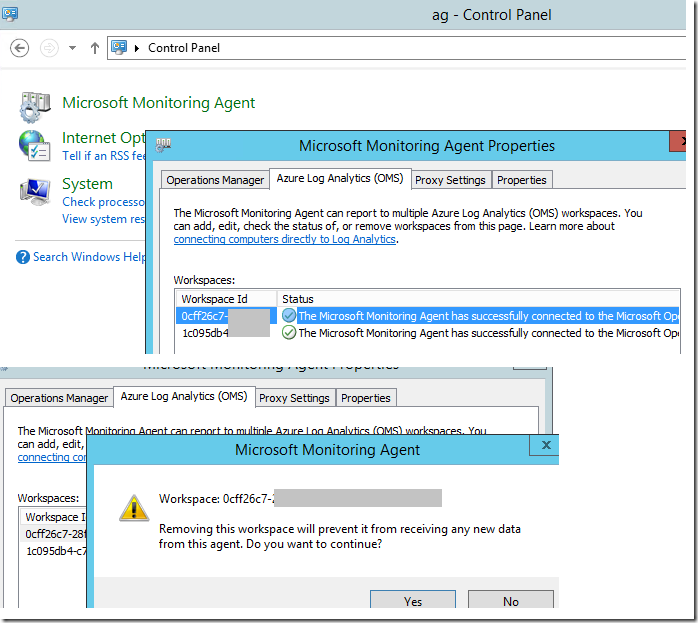
If required, the connection to an OMS Workspace can be removed from a Direct Agent by deleting the corresponding Workspace Id from the Azure Log Analytics (OMS) tab in the Microsoft Monitoring Agent configuration applet in Control Panel:
A special thanks to my colleague Nick Eales for facilitating the environment with the right conditions for me to run my tests and validate the outcome.
Disclaimer:
All information on this blog is provided on an as-is basis with no warranties and for informational purposes only. Use at your own risk. The opinions and views expressed in this blog are those of the author and do not necessarily state or reflect those of my employer.