Profiling Visual Studio Development Web Server
Here are the steps to profile Visual Studio ASP.NET Development Web Server using NP .NET Profiler.
Download NP .NET Profiler tool from here
Download the x86 version as Visual Studio ASP.NET Development Web Server is 32-bit process
Extract the NP_x86.zip to c:\temp folder
Double click on the NP.exe
Click on the “New Profiler Run” button on the top left
Click on the “Show Advanced Options” checkbox
Click Next
Set the application type to “.NET Process”
Click Next
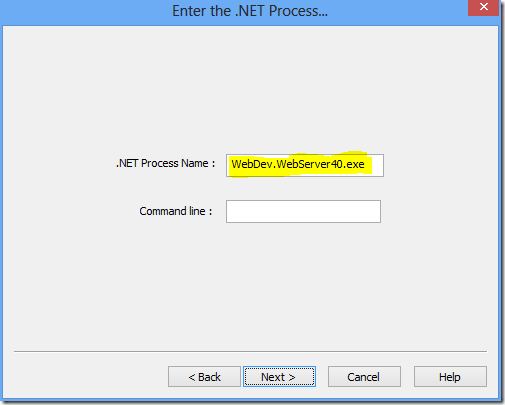
Depending on Visual Studio version, set the .NET Process Name as shown below:
- For Visual Studio 2008 – set the .NET Process Name to WebDev.WebServer.exe
- For Visual Studio 2010 – set the .NET Process Name to WebDev.WebServer40.exe
- For Visual Studio 2012 – set the .NET Process Name to iisexpress.exe
Click the image for a larger view
Click Next
Select profiler type and click Next
Set the profiler filters and click Next
Set the options and click Next
Click on the “Start Profiling” button
Now NP .NET Profiler tool is “waiting for process to restart…. ”
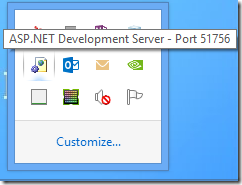
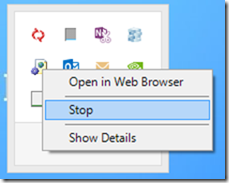
Stop all existing ASP.NET Development Servers from the System Tray as shown :
Close Visual Studio (why? check the below FAQ)
Restart the Visual Studio and open the Web Project
Hit F5 in the Visual Studio to launch a new instance of ASP.NET Development Server
Now, NP .NET Profiler tool should display “Profiler Loaded” message
Run test on the web application to reproduce the problem
Once the problem is reproduced, stop all existing ASP.NET Development Servers from the System Tray
Now click on the “Stop Profiling” button in NP .NET Profiler tool
Next, click on the “Show Reports”
FAQ
Why do we have to restart Visual Studio ?
NP .NET Profiler is developed using ICorProfiler interfaces . These interfaces are triggered by CLR Runtime only if certain environment variables are set. So to profile any .NET application we have to set the environment variables and restart the process. (For .NET 4.0 and above, we can do few profiler operations without the process restart) A child process’s environment variables are set by parent process’s environment variables. Here the ASP.NET Web Development Server is launched by Visual Studio. So we have to restart the parent process – Visual Studio, so that it reads the new profiler related environment variables and pass these variables to its child process – ASP.NET Web Development Server.
Here is screenshot from Process Explorer : note the WebDev.WebServer40.exe is under devenv.exe
Click the image for a larger view
Why not use “Web App Hosted in Visual Studio” option in the NP .NET Profiler?
In the current release (4.9.3.0), there is a bug which fails to set the right environment variables. Because of this bug, CLR runtime doesn’t load the profiler dll and NP.exe always displays the message “waiting for process to start…” forever.
Why do we have to stop ASP.NET Development Server after successful profiling ?
Even after clicking on the “Stop Profiling” button in NP .NET Profiler tool, the ASP.NET Development Server is still running and is still holding on to the log files. These logs files are closed only when the ASP.NET Development Server is stopped.


