App-V 5.0 – ETW Tracing Automation [Update]
Hi all,
I've had some feedback on a post that I did on VirtualWorld stating it took along time to convert the ETL output into a readable format so its time to share the updated script to address this.
https://blogs.technet.microsoft.com/virtualworld/2014/04/12/app-v-5-0-etw-tracing-automation/
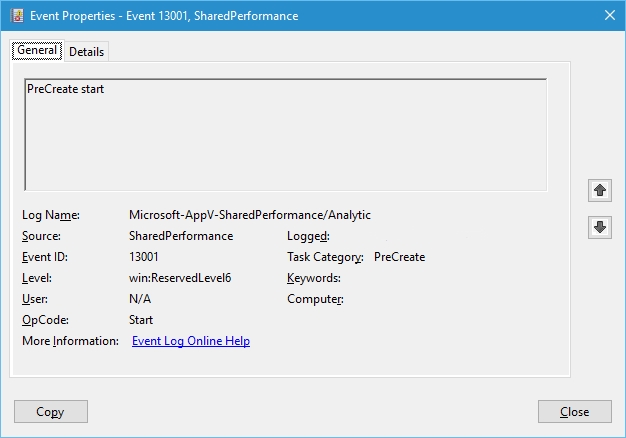
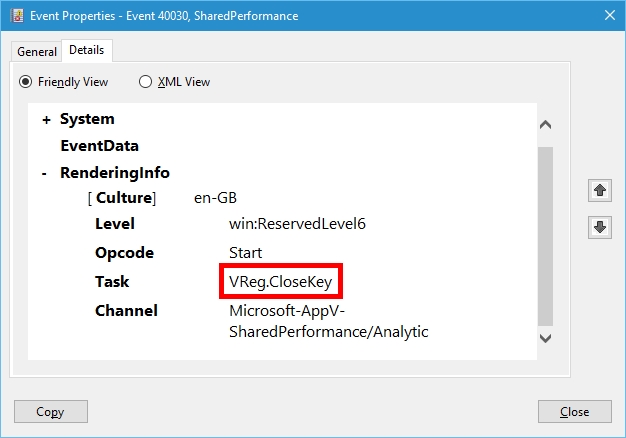
When you collect the trace you will see a lot of "SharedPerformance" entries as shown below.
The "SharedPerformance" entries provide information about how the App-V 5 Client is performing when completing tasks, e.g "VReg.CloseKey" of the App-V 5 environment.
To remove these entries from your debug trace you can run the following script which checks "if $entry is not Microsoft-AppV-SharedPerformance", then add it to the collector.
 $trace = "APPV5Debug"
$Date = get-date -f "ddMMhhmm"
$ETL_trace_output = "c:\temp\appv5Debug.etl"
$EVTX_trace_output = "c:\temp\appv5Debug$Date.evtx"
$TXT_trace_output = "c:\temp\appv5Debug$Date.txt"

$Random = Get-Random
$ProviderFile = "$env:temp\AppVClientProviders$Random.txt"

$Providers = Get-WinEvent -ListProvider Microsoft-AppV*

$AppVProviders = $Providers.Name | sort

foreach($entry in $AppVProviders){

    if($entry -ne "Microsoft-AppV-SharedPerformance"){
    ac $ProviderFile $entry
    }

}

write-host

$query_logman = logman query APPV5DEBUG

if($LASTEXITCODE -eq "-2144337918"){
write-host "Data Collector Set was not found"
write-host
write-host "Creating Logman Trace..."
logman.exe create trace $trace -o "$ETL_trace_output" -f bincirc -max 512 -pf "$ProviderFile" -ct perf -ow --v
write-host
}

elseif($LASTEXITCODE -eq "0"){
write-host "Data Collector Set already exists..."
write-host "Deleting to ensure all the App-V Collectors are available..."
write-host
logman.exe delete $trace
write-host "Creating Logman Trace..."
logman.exe create trace $trace -o "$ETL_trace_output" -f bincirc -max 512 -pf "$ProviderFile" -ct perf -ow --v
write-host
}

$Start_Trace = read-host -prompt "Do you want start the trace now? (Y/N)"

if ($Start_Trace -eq "Y" -or $Start_Trace -eq "y"){
write-host "Starting Logman Trace $Trace" -f yellow
logman.exe start $trace
write-host
}
elseif ($Start_Trace -eq "N" -or $Start_Trace -eq "n"){
write-host "You will need to start the trace manually from perfmon.exe..." -f yellow
}

$Stop_Trace = read-host -prompt "Do you want stop the trace now? (Y/N)"

if ($Stop_Trace -eq "Y" -or $Stop -eq "y"){
write-host "Stopping Logman Trace $Trace" -f yellow
logman.exe stop $trace
write-host
write-host "Converting Trace to EVTX format..."
tracerpt.exe -l $ETL_trace_output -lr -of EVTX -o $EVTX_trace_output
write-host
write-host "Converting Trace to TXT format..."
Netsh trace convert $ETL_trace_output $TXT_Trace_output DUMP=TXT report=no
write-host "TXT file written to $TXT_Trace_output..."
write-host
write-host "Opening EVTX trace - $EVTX_Trace_output..."
Invoke-Item $EVTX_Trace_output
}
elseif ($Stop_Trace -eq "N" -or $Stop_Trace -eq "n"){
write-host "You will need to stop the trace manually from perfmon.exe..." -f yellow
}
SCRIPT DISCLAIMER
The sample scripts are not supported under any Microsoft standard support program or service. The sample scripts are provided AS IS without warranty of any kind. Microsoft further disclaims all implied warranties including, without limitation, any implied warranties of merchantability or of fitness for a particular purpose. The entire risk arising out of the use or performance of the sample scripts and documentation remains with you. In no event shall Microsoft, its authors, or anyone else involved in the creation, production, or delivery of the scripts be liable for any damages whatsoever (including, without limitation, damages for loss of business profits, business interruption, loss of business information, or other pecuniary loss) arising out of the use of or inability to use the sample scripts or documentation, even if Microsoft has been advised of the possibility of such damages.
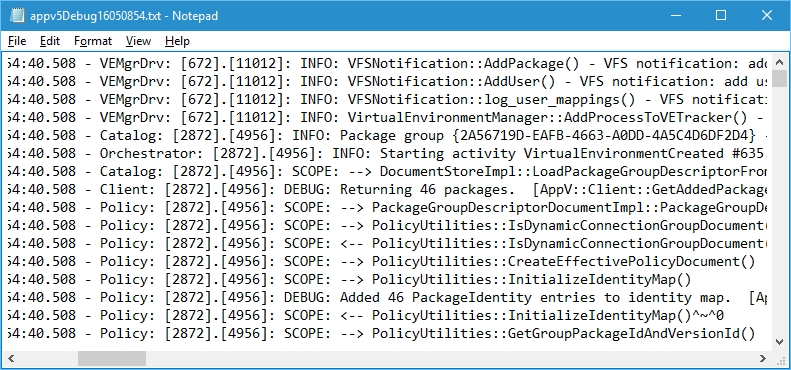
Now the ETW tracing will be a lot quicker in the conversion and I've also added the export to TXT file for those who prefer TXT file manipulation.
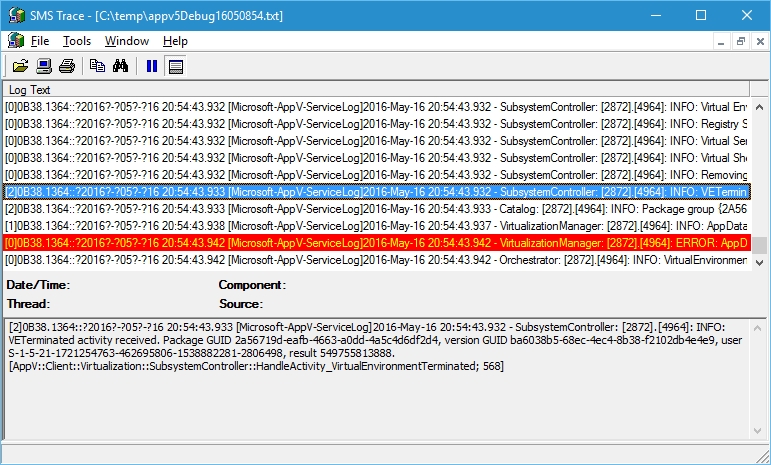
You could always use trace32.exe or cmtrace.exe to view the data.
Hope this update helps in your troubleshooting.
David Falkus | Senior Premier Field Engineer | Application Virtualization, PowerShell, Windows Shell
Comments
- Anonymous
July 11, 2016
Awesome stuff


