How To: Use Perfmon in Windows 7
Syed Aslam Basha here from the Information Security Tools team.
This blog post is in continuation with How To: Identify Memory Leaks In An Unmanaged Application blog post. I will show how to setup perfom to collect data for the selected counter in Windows 7.
Steps to configure perfmon:
- Click on start –> Click on Run
- Enter Perfmon and press enter, click on Yes
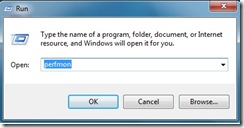
- It launches performance monitor
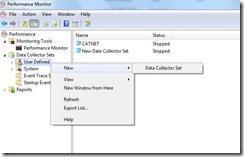
- Click on Data Collector Sets
- Select User Defined node and right click on it
- Select New and Data collector Set
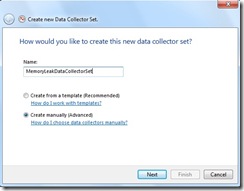
- Enter a Name, select create manually and click on Next
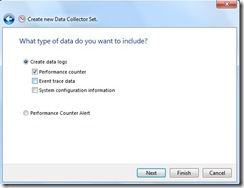
- Select create data logs, performance counter and click on Next
- Click on Add
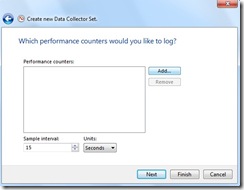
- Select the required counters say processor Time, Add and click on Ok
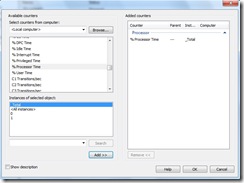
- Click on Next
- Browse to a folder, click on next
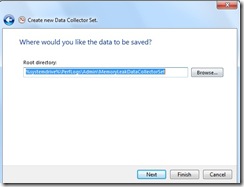
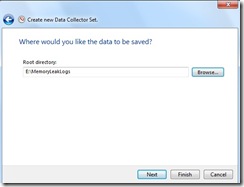
- You can enter run as user details by clicking on change button
- Select save and close and click on finish
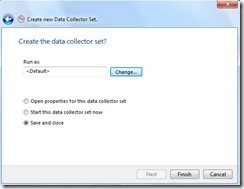
- The user data collector is created
- Right click on the newly crated data set and click on start
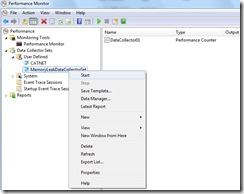
- Right click and select properties if you wish to change properties defined at any point of time
- Once you are done with your application testing, right click and select stop
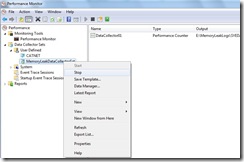
- The log file is created and stored at the folder mentioned in the above steps
- Open the log file and analyze the data for each counter
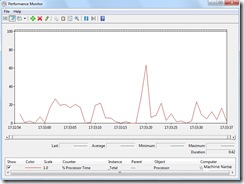
- Publish the results
-Syed Aslam Basha ( syedab@microsoft.com )
Microsoft Information Security Tools (IST) Team
Test Lead
---------------------------------------------------------
Please leave a comment if the blog post has helped you.