Windows Performance Monitor Overview
Hello AskPerf! My name is Matt Graham and I will be writing a high level overview of the capabilities of Windows Performance Monitor. The intention of this blog post is to introduce new users to this powerful, and often underutilized, tool. So rather than going through each part of Performance Monitor and explaining it in depth, my aim here is to offer a quick guide to the tool.
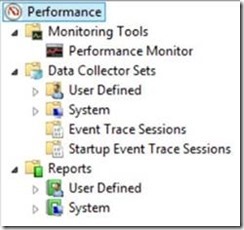
When you first open Performance Monitor (perfmon), you see the following:
Let's briefly go through each one and talk about what they do.
Performance
At the very top level "Performance" gives you an overview of your systems memory usage, network usage, disk usage, etc. You can right click on "Performance" and connect to another computer to view a remote computers performance statistics. (NOTE: Should add brief comments about what is required in order to remotely connect to another machine…)
Monitoring Tools
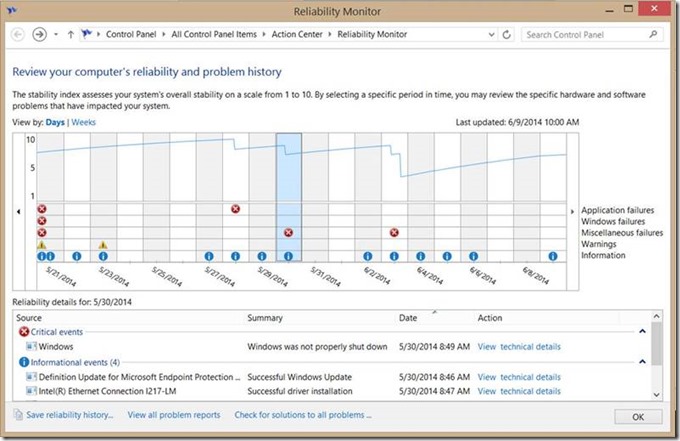
From the Monitoring Tools icon you can right click and launch the Resource Monitor. Resource Monitor is another powerful tool that can help you see how your system resources are being used. You also have the ability to launch the System Reliability Monitor. This utility allows you to see information about software updates and installations. You can also see critical events that occurred and on what day those events occurred. Finally, you can see all of the problem reports that have been sent from your computer by clicking on the "View all problem reports" link at the bottom of the window.
Performance Monitor
The Performance Monitor is primarily for viewing real time statistics. By default only one counter is selected; the %Processor Time counter. However you can add additional counters by clicking on the green plus sign. This will allow you to monitor any counters you wish in real time.
While you can see all of the performance counters you like here, the real power of Performance Monitor is found in its ability to capture performance metrics over an elapsed period of time. Capturing data over a period of time allows you to see trends and these trends are what are most useful for determining the overall performance of your system. To capture this data, you can create what are called "Data Collector Sets".
Data Collector Sets
Data Collector Sets are aptly named. They collect data from your system so that you can view changes in configuration information and performance information over a specified period of time.
There are basically three types of data collector sets:
Performance Counter |
Capture data based on the polling of an event at a specified time interval |
Event Traces |
Capture data based on events that occur rather than based on a specified time interval |
System Configuration Information |
Capture configuration information |
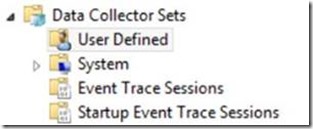
Under Data Collector Sets you can see the following:
User Defined
Under User Defined, you can create your own custom Data Collector Set. These Data Collections Sets can contain counters, traces, and configuration collectors. You can right click on User Defined and select New -> New Data Collector Set to create one. You can create a data collector set from a template or create your own custom set. Let's create a custom one:
1. Name your Data Collector Set and select "Create manually (Advanced)".
2. On this screen you can choose to create data logs (counter / trace / config) or you can create a Performance Counter Alert. The "Performance Counter Alert" option allows you to create alerts based off of certain performance values and thresholds. For now, we will select "Create Data Logs" and place a check box in all three boxes:
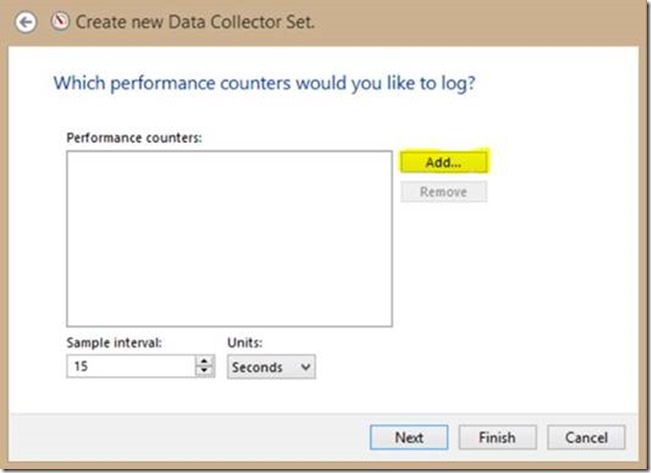
3. On the screen below you can set the counter interval rate (how often do you want it to capture the selected data) and the specific counters that you want to capture.
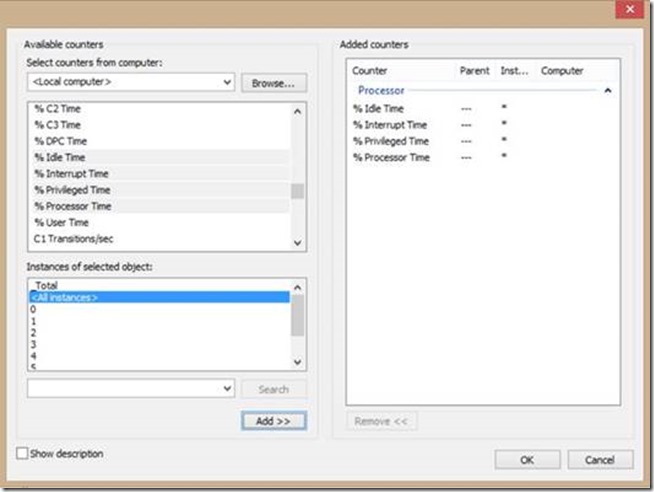
4. Once you click Add, you can select counters and then add them to the "Added Counters" box. Note that you have options in terms of whether you want Perfmon to collect the data as a total or if you want to break the data up, in this case, per processor. You should pay attention to which one you select as the meaning of these counters depends on what is being counted.
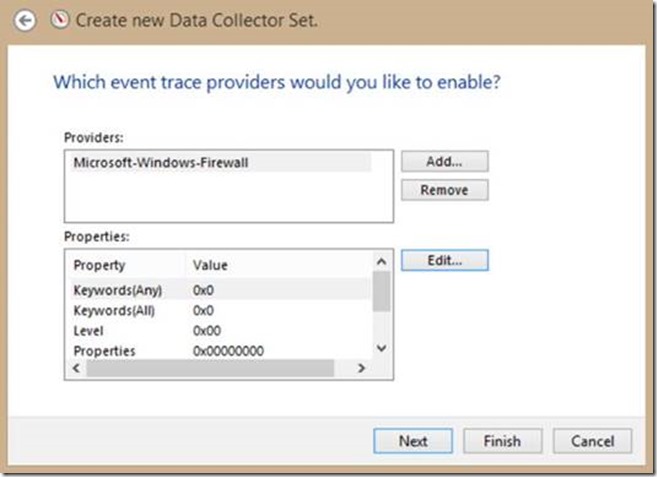
5. You will then be prompted to add trace providers. Trace providers simply provide information to perfmon about a specific set of events. For example, if you wanted to collect event information about the Windows Firewall, you would select the "Microsoft-Windows-Firewall" provider. You can then edit the properties (if you know what you are doing) and even record registry keys (after you hit next you can specify which keys to record).
6. You can also specify a location where you would like to save the data. By default, the data is saved to: %systemdrive%\PerfLogs\Admin\New Data Collector Set.
7. Finally, you can select a user that you would like to run the data collector set as. This may be helpful in environments where desktops and servers are locked down for security purposes.
If you look at the "New Data Collector Set" that we just created, you can see that it contains a performance counter, a trace, and a configuration collector. You can right click on any of these to modify them as you see fit.
Finally, if you look at the remaining items under Data Collector Sets, you can see a bunch of preconfigured collector sets.
Reports
The final part of Performance Monitor is the Reports section. Here you can view the information that was collected by your data collector sets. If you have never run your data collector set, then you will not see any information when you click on it.
However, once you have run your data collector set, you can click on it and see the reports and information collected:
So this is a basic overview of Windows Performance Monitor. Once you are familiar with the parts, you can then dive into learning about which counters to use when, and what your counter interval rate should be when you are trying to capture this kind of data vs that kind of data.
Additional Resources
- Two Minute Drill: LOGMAN.EXE
- Two Minute Drill: TYPEPERF
- Two Minute Drill: RELOG.EXE
- Windows Perofrmance Monitor (TechNet)
Comments
- Anonymous
July 17, 2014
The comment has been removed
