Identifying the cause of SQL Server IO bottlenecks using XPerf
In a previous blog post (Troubleshooting SQL High CPU usage using Xperf), we covered the xperf basics, what types of scenarios are appropriate for xperf, and more specifically, how to look at CPU sampling within xperf. In general, user CPU time would be investigated using the standard SQL Server tools such as Profiler/Extended Events, DMV's, and Perfmon. A more real world use for SQL DBA's to use Xperf is in the event of slow IO and/or stalled IO's.
Currently to troubleshoot IO issues within SQL Server, we would generally make use of Perfmon to determine if IO response times and throughput are within expected ranges. We may also use DMV's such as sys.dm_io_pending_io_requests or sys.dm_io_virtual_file_stats to monitor for stalled IO and couple that with sys.dm_os_wait_stats to determine if IO performance is effecting SQL Server performance. This can give us a solid idea that IO performance is an issue but it does not give us very much information as to where the problem actually lies. All the DMV's in SQL Server are tracking the IO's from the point a file operation (READ, WRITE, etc) occurs. The temptation is to relate these delays to a physical disk or SAN performance issue. However if we look at the full IO stack for an application, we can see there are many levels an IO must go through to get to the actual physical disk and back. Below is a visualization of the Windows Storage architecture from: https://technet.microsoft.com/en-us/library/ee619734(v=WS.10).aspx
From <https://technet.microsoft.com/en-us/library/ee619734(v=WS.10).aspx>
SQL Server is monitoring the IO's at the application level, and perfmon gets us a bit further down the stack to where it plugs in after the Partition Manager, but still leaves some ambiguity as to where IO delays are coming from exactly. Many times IO delays are introduced by driver issues which are not related to the backend physical disk performance. This leads to finger pointing between DBA's and Storage Admins as the DBA's see slow perf and blame the disks and the storage admins say perf on the disks are great. With perfmon and standard sql tools, we cannot easily uncover driver issues.
This is where Xperf can greatly help troubleshoot slow or stalled IO. With the Drivers and FLT_IO_* kernel flags, we can see how much time is spent in the different levels of the IO stack down to the StorPort driver. This functionality was added in Windows 2008 R2 and the ntdebugging blog has some great details here. Let's look at an example SQL Server IO Stall from the SQL Server Errorlog:
2013-02-26 07:49:31.500 spid8s SQL Server has encountered 1 occurrence(s) of I/O requests taking longer than 15 seconds to complete on file [E:\slowio\compressed.ndf] in database [slowio] (13). The OS file handle is 0x0000000000000B9C. The offset of the latest long I/O is: 0x00000005c00000
I have captured an xperf trace at the same time this error was raised. I used the following command to capture detailed IO information:
XPERF -on PROC_THREAD+LOADER+
FLT_IO_INIT+FLT_IO+FLT_FASTIO+FLT_IO_FAILURE+
FILENAME+FILE_IO+FILE_IO_INIT+
DISK_IO+HARD_FAULTS+DPC+
INTERRUPT+CSWITCH+PROFILE+DRIVERS+DISPATCHER
-stackwalk MiniFilterPreOpInit+MiniFilterPostOpInit+
CSWITCH+PROFILE+ThreadCreate+ReadyThread+
DiskReadInit+DiskWriteInit+DiskFlushInit+
FileCreate+FileCleanup+FileClose+FileRead+FileWrite
-BufferSize 1024 -MaxBuffers 1024 -MaxFile 1024 -FileMode Circular
Note, I was having issues with my initial traces having a large number of dropped events. You will drop events if the buffers used by Xperf fill and Xperf cannot write them to target file fast enough. To help prevent dropped events 1) set the -f parameter to a drive that is not used by the application you are troubleshooting and 2) increase the buffers and buffer size. In this case, I added the -BufferSize and -MaxBuffers to my command line to give me a 1GB buffer in memory. As mentioned in the previous blog, xperf logs do grow fairly quickly and a command like above will potentially grow rapidly. Because of this I have set the –MaxFile size to 1024MB and –FileMode to Circular. This will keep my output to 1GB but it does mean that the trace will start to overwrite itself once it has collected 1GB of data. With this it is important to stop the trace as soon as the problem occurs to prevent losing the data for the event you wanted to investigate.
Now that I have the trace, as with before it is important to load symbols since I collected the stackwalk option.
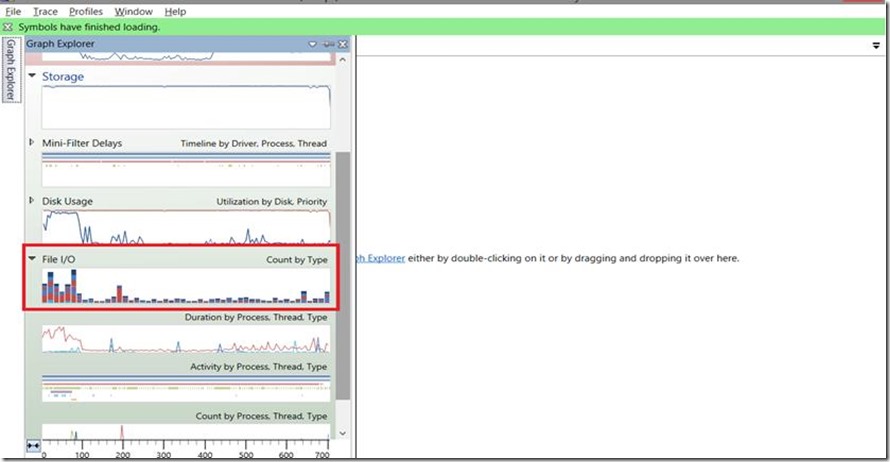
Opening the trace with Windows Performance Analyzer, I'm starting with the File I/O Count by Type graph. This graph shows the timing and count of file level operations. In this situation, this would be at the top of the IO Stack with sql server issuing READFILE/WRITEFILE commands against the data files.
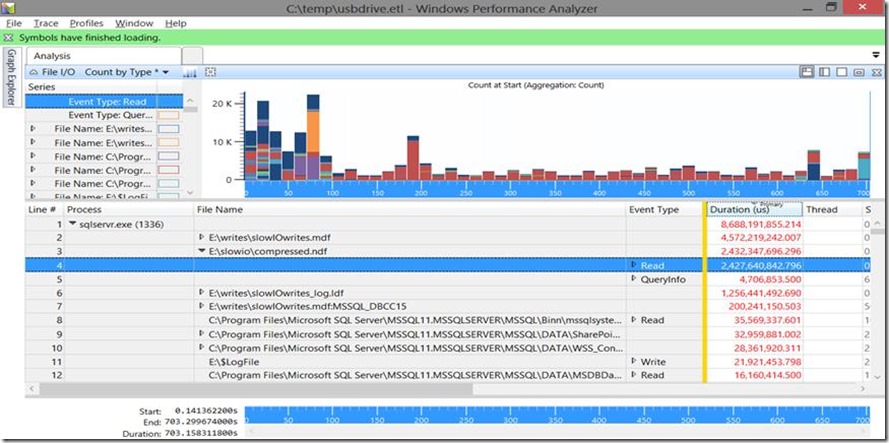
After opening the FileIO graph, since we know the process and the filename, I have setup my grouping on Process, File Name, and Event Type. We can then drill down to the problem file we saw in the event log.
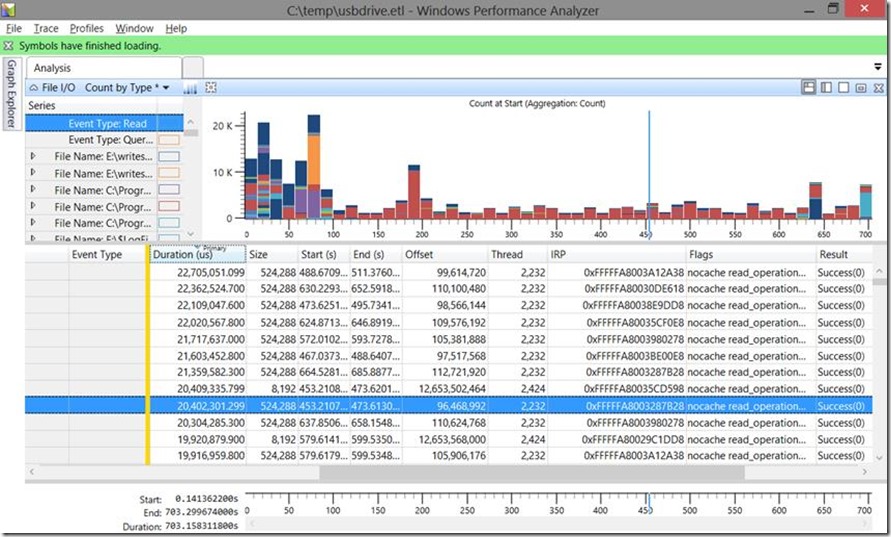
If we then expand out the Read Event Type, we will see each individual Read operation and details about that operation. The details show us Duration, Start and End Time, Size, Offset, etc. The Offset is of particular interest as we can use the Offset column in Xperf to find the Offset found in the sql server errorlog: 0x00000005c00000. Note that Xperf stores offsets as decimal so we have to convert it to decimal: 0x00000005c00000 = 96468992
I have the IO highlighted here and now we can see this particular read took 20 seconds to complete, that it was a 512KB read operation, and we have the start and end time. Note the start and end times are the number of seconds from the start of the trace. Right away from Xperf we can see this was not an isolated event. In my graph we can see many other IO's on this file taking longer than 15 seconds. Also if I were to look at other database files I would see the same thing so this is not isolated to a single file.
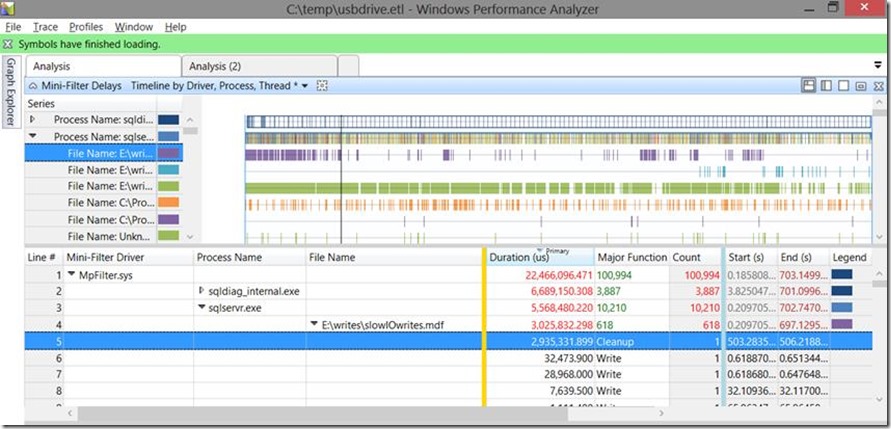
While this tells us what the IO's look like from the file level, we need to know where the delays are coming from. For that we can look at two other graphs: Mini-Filter Delays and Device I/O. Let's start by looking at the mini-filter delays chart:
In the above chart, we can see which mini-filter drivers (Anti-virus, encryption) and how much time was spent in each filter drive. AV software or encryption could introduce delays and this graph gives us insight into any issues here. In my example, we see there were 22 seconds of delay due to the MpFilter.sys. A quick Bing search and we can find that the MpFilter.sys is related to Forefront endpoint protection (anti-virus). We can dig further to see if the AV software is impacting sql server and if so what file:
In this case, we do see SQL Server is being impacted and that a specific cleanup operation was delayed for almost 3 seconds on the slowIOwrites.mdf. For my repro, I purposely did not set any exceptions to the AV filter thus why AV is scanning my .mdf files and I was running a scan of the drive at the time of the trace. The simple solution here is to go in and review the AV configuration and ensure proper exceptions are set as documented in https://support.microsoft.com/kb/309422. The broader point here being that with xperf, we can now see how much time is being spent in filter drivers and we can perform fact based research to determine if things like anti-virus software are at the root of our issues.
Now let's look at the device IO graph for more info about what is happening throughout the IO stack:
Above, we can see all the different device drivers that an IO must go through to satisfy an IO request. Note that this is a stack structure so delays in a lower driver will show in a higher level driver. For instance here we see the fltmgr.sys and ntfs.sys consuming a lot of time. The ntfs.sys is below fltmgr.sys so the fltmgr.sys also accounts for the time spent in ntfs.sys. What we do see is that there is a ~40 second difference between the two and if we go back and look at the Mini-Filter chart we'll see where much of that time came from.
Looking back at the IO stack chart above, we note that the storeport.sys is about as low on the stack as we can see before an IO is handed off to the disk. In general, if we were having issues specific to the disks, we should see high duration in the storport.sys. Interestingly, in my example, there is very little time spent in storport.sys so we know that our issue is not likely with the drive itself. The vast majority of delay is in the ntfs.sys. In this case, I know I can let the storage team off the hook. The more likely culprit for my repro was that this is a virtual machine using dynamic disks on the host NTFS volume which was attached by USB. Also, I was creating contention on the USB drive with other disk operations on the host drive. The host drive and the guest drive had bit-locker enabled. Basically I threw every bad thing I could at this drive and thus the root cause could be a number of things, but in the end it is a configuration issue with the VM and guest drive and not an issue with the physical disk itself.
As you can see, xperf gives us much greater visibility into the process of satisfying an IO request. We can now use a much more fact based approach to troubleshooting delayed IO and provide a more targeted approach to these issues.
Joe McTaggart -- Premier Field Engineer
Comments
Anonymous
April 23, 2013
This is a fantastic article, thank you for going so in depth!Anonymous
April 26, 2013
Thanks for the feedback William.Anonymous
July 06, 2013
Great article. Might be worth mentioning this hotfix: support.microsoft.com/.../2666390 I had to install it on my Windows 7 laptop to get the mini-filter delays graph to appear. I haven't had a chance to try this yet on 2008 R2 (which the hotfix states it is for), but I would expect that it is required there too.Anonymous
May 14, 2014
Joe- Any chance you are still monitoring this post? I am experiencing what appears to be slow I/O issues with tempdb on a SQL 2008 R2 server which includes but is not limited to Dynamics AX 2012 and the Dynamics Management Reporter. Following your example, I thought I nailed down the I/O issue and the initial results supported this. However the problem appears to have re-surfaced. I wonder if I might be able to bend your ear for some further advice. Thank you, AlexAnonymous
May 14, 2014
Can you check to see if you have any outstanding records in sys.dm_io_pending_io_requests?Anonymous
May 14, 2014
The comment has been removed


