Collecting Data Using Xperf for High CPU utilization of a process
We can investigate the high CPU utilization for a process using xperf tool.
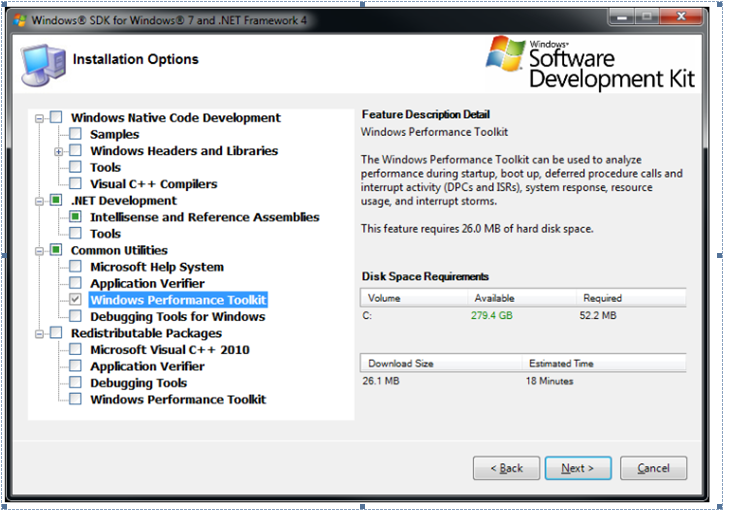
Please download it from here https://www.microsoft.com/download/en/details.aspx?displaylang=en&id=8279 and choose following installation option while installing it.
It would install windows performance tool kit in c:\program files and you will find a folder by this name in program files. Please copy all the files in this folder , create a folder in C drive with name xperf(you can give it any name ) and paste all the files copied from performance tool kit folder( this step is to ease the process of data capture).
Note: Please add DisablePagingExecutive reg key to collect xperf data using method given below
Open an elevated command prompt and run following command to enable the key for xperf
REG ADD "HKLM\System\CurrentControlSet\Control\Session Manager\Memory Management" -v DisablePagingExecutive -d 0x1 -t REG_DWORD -f
Reboot the server to activate this key.
Collection of Data
Please follow the below steps while doing repro of the issue or when the issue is happening.
Open an elevated command prompt and go to c:\xperf . Then type following command
xperf.exe –on Latency –stackWalk Profile
Then after 2 to 3 minutes on the command prompt type following command
xperf -d HighCPU.etl
you should have file HighCPU.etl in the xperf folder. About how to analyze this data please refer to following video
[View:https://www.youtube.com/watch?v=vyabPTXHYb8]
Comments
Anonymous
September 11, 2012
Great article.Anonymous
December 13, 2013
Great Article, one suggestion though. Maybe go into a better explanatino of how to configure symbols.Anonymous
April 07, 2015
Great! Thanks.Anonymous
September 24, 2016
The comment has been removed
