ASP.NET Web API Tracing (Preview)
Together with the official release of ASP.NET Web API we released the Microsoft ASP.NET Web API Tracing preview package. It can be installed into a Web API application to allow framework and user code to trace activities to System.Diagnostics. Let’s look at how this works and how to use it.
Overview
As I mentioned in Tracing in ASP.NET Web API the framework code looks in the HttpConfiguration to see if an ITraceWriter service has been registered. If so, Web API code calls it to describe each operation it performs. A custom ITraceWriter can listen to those traces and do whatever it wants with them, such as writing them to a file or a database. The preview package described here is such a custom ITraceWriter, and it sends those traces to System.Diagnostics.Trace.
System.Diagnostics.Trace has been a part of .Net for quite awhile and is often used by both application and framework developers to debug and diagnose code. By making your Web API application write to it using this preview package, you can take advantage of existing mechanisms to capture and analyze these traces.
Installing the ASP.NET Web API Tracing preview package
To get ASP.NET Web API itself, you can either install Visual Studio 2012 and .NET 4.5 or you can download Web API for Visual Studio 2010. Web API is an open-source project, so you can also get the source code from the Open Source home on codeplex.
Once you have it installed, you can create a new ASP.NET Web API application using File | New | Project… | Web | ASP.NET MVC 4 Web Application.
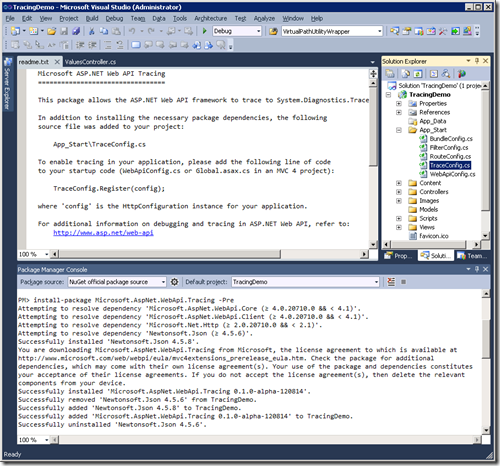
Next install the Microsoft.AspNet.WebApi.Tracing pre-release Nuget package as described at Microsoft ASP.NET Web API Tracing. At this point, you will have an application that looks like this:
Enabling and configuring the System.Diagnostics Trace Writer
Installing Microsoft.AspNet.WebApi.Tracing makes these changes to your project:
- Updates packages.config and adds a reference to your project to System.Web.Http.Tracing.dll
- Installs the file App_Start\TraceConfig.cs
Before you can use this trace writer, you must enable it by manually adding a line of code to App_Start\WebApiConfig.cs to invoke TraceConfig.Register(). The ReadMe.txt that appears after installation describes this, but here is a screenshot showing the line after I have added it:
At this point, tracing is enabled and you can run your app. But first let’s look at the code that was added to your app to see how we can configure it.
Configuring the trace writer
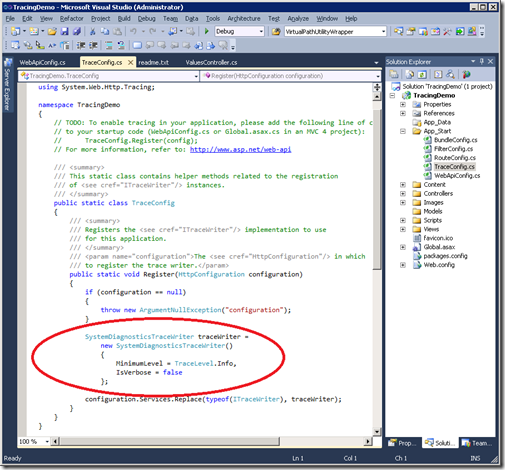
Installing the preview package creates the file App_Start\TraceConfig.cs in your project. This code registers the SystemDiagnosticsTraceWriter class in the configuration and is where you go to configure tracing.
By default, it is configured for:
- MinimumLevel = TraceLevel.Info: will trace all Info, Warn, Error and Fatal traces
- IsVerbose = false: traces only minimal information in each trace
Feel free to change these as you like. For example, setting MinimumLevel to TraceLevel.Warn will write only Warn, Error and Fatal traces. Setting IsVerbose to true will include more information in each trace.
Debugging with the Output window
To see this tracing in action, start the app under the debugger (F5) and open the Output window in Visual Studio. In the screen shot below, I have used Fiddler to issue a GET request to https://localhost:64758/api/values to access the ValuesController created by the default MVC 4 project template.
The output window contains the Web API traces of all the operations performed in the handling of that request. Each trace describes the operation that was performed as well as any errors that were encountered. In this case, it was a successful request, and we can see everything Web API did to service that single request.
If I change the SystemDiagnosticsTraceWriter.IsVerbose to true and re-run the app, I see more detailed trace information as shown in the next screen shot.
In this case, each trace record contains additional information, including the timestamp (UTC) and the GUID for the request. It also shows 2 traces for each activity; the “Kind=Begin” trace occurs prior to starting an activity. The “Kind=End” trace occurs when the activity completes. This pair of events is handy during debugging because you can know what activity was executing at the point an error occurred, even if you don’t have a stack trace.
The verbose form of tracing is more appropriate when writing to a store or for later analysis because it contains enough information to correlate all traces to a specific request.
The non-verbose form is often better for interactive debugging where less is more.
Debugging with Intellitrace
Visual Studio also has an Intellitrace feature that is handy for debugging. It registers a TraceListener with System.Diagnostics.Trace, meaning anything your app traces via the Microsoft.AspNet.WebApi.Tracing package will be seen by Intellitrace too.
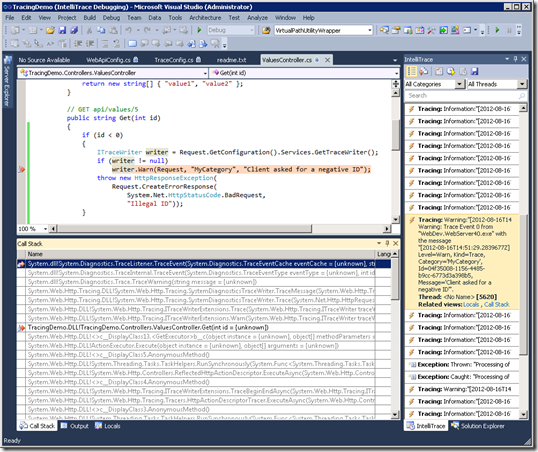
In the next screen shot, I have run the app, issued an illegal HTTP request, and opened the Intellitrace window. I have also used Tools | Options | Intellitrace to enable the Tracing category. Notice that each trace written by Web API appears in Intellitrace. Each trace has also caused Intellitrace to capture the stack for later analysis. You don’t have to set a breakpoint. You can just run the app for the entire request and then come back later to examine what the stack looked like at each step.
In this example, I noticed a Warning level trace and clicked on it. Intellitrace shows the stack as it appeared at the time that trace was received. Moreover, it analyzed the stack and recognized my user code was involved in this call. It then opened my source code and took me to the line of code where the trace occurred. In this case, you can see a validation check I had added to my ValuesController.Get() method. I chose to write a warning to the ITraceWriter myself so that my own traces were correlated with the Web API framework traces.
Quite a lot of information from a single click, wasn’t it?
You can learn more about using Intellitrace here. It can be pretty useful for debugging, and oddly is not widely known or used.
Perhaps more importantly in this context, it also demonstrates that writing to System.Diagnostics.Trace lights-up existing tooling that register TraceListeners with System.Diagnostics.Trace.
One example of such a TraceListener is the Windows Azure Diagnostics package, also known as WAD. If you deploy your MVC4 Web API application on Azure and configure the DiagnosticMonitor, anything written to System.Diagnostics.Trace will be stored in cloud table storage (WADLogsTable).
In other words, by installing this Microsoft.AspNet.WebApi.Tracing preview package and configuring WAD’s DiagnosticManager, you have enabled your Web API application to write its traces to persistent table storage in the cloud.
If future articles, I’ll describe how you can use this, but if you want a sneak preview look at Windows Azure Diagnostics.
Comments
Anonymous
August 16, 2012
If i put the configuration in the code, how do you change it during runtime?Anonymous
August 22, 2012
If you wanted to change something at runtime, such as the level or verbosity, you just need to get back to the trace writer instance in the config and set those properties. In this case, it would be okay to do an HttpConfiguration.Services.GetTraceWriter(), downcast it to SystemDiagnosticsTraceWriter and set a property. Any change to verbosity, level or TraceSource should be respected on the very next trace. Is that what you're looking for?Anonymous
December 14, 2012
"You can learn more about using Intellitrace here. It can be pretty useful for debugging, and oddly is not widely known or used." It is my understanding that you have to have Visual Studio Ultimate in order to use Intellitrace. Perhaps this is the root issue of "not widely known or used"?


