Getting started with NetExt
DISCLAIMER: NetExt is a free and open source WinDBG application that makes .NET debugging much easier as compared to the current options: sos or psscor. This extension is not a Microsoft product and limited support is provided only via its codeplex page. For now I am the only architect/developer, so you may experience delays in my responses.
Installing NetExt
I had released the WinDBG extension NetExt back in 2013 and recalled it soon after in order to port to use another .NET Debugging API. The bad part is that it is not pure (and standalone) C++ as it used to be. The good part is that it is much easier to add new features with this new API.
If you are new to WinDBG you first have to download the WinDBG version compatible with your operating system. For .NET you need to use WinDBG 32-bits to debug a 32-bits dump file (or process) and WinDBG 64-bits their 64-bits counterparts. To download the installer for both version go here: https://msdn.microsoft.com/en-us/library/windows/hardware/ff551063(v=vs.85).aspx
The installation is via WDK or SDK. I suggest the SDK installation. During the installation you can select only the debugging tools if you are not interested in the full SDK. To do this unselect all but Debugging Tools for Windows when you get in the “Select the features you want to install” in the install wizard:
If you install the SDK for Windows 8.1, your installation folders will be C:\Program Files (x86)\Windows Kits\8.1\Debuggers\x64 and C:\Program Files (x86)\Windows Kits\8.1\Debuggers\x86 for the 32-bits and 64-bits versions respectively.
After WinDBG is installed, you download NetExt here: https://netext.codeplex.com/. At the time of this writing the current version is 2.0.1.5000. Unzip the file you downloaded. Copy all content of the x64 folder to your WinDBG 64-bits installation folder (e.g: C:\Program Files (x86)\Windows Kits\8.1\Debuggers\x64). Copy all content of the x86 folder to the 32-bits installation of WinDBG (e.g. C:\Program Files (x86)\Windows Kits\8.1\Debuggers\x86). IMPORTANT: you may be required to provide administrator credentials. Normally you should be able to chose any folder for the extension but a bug I thought I had resolved requires that at least Microsoft.Diagnostics.Runtime.dll is located at WinDBG root folder.
Debugging requires symbol files. As there is some delay in downloading symbols it is a good idea to have a symbol cache locally. As I spend most of my days debugging, I always create a symbol folder c:\symbols and I add the symbol path environment variable to set the symbol location (see more here: https://support.microsoft.com/KB/311503).
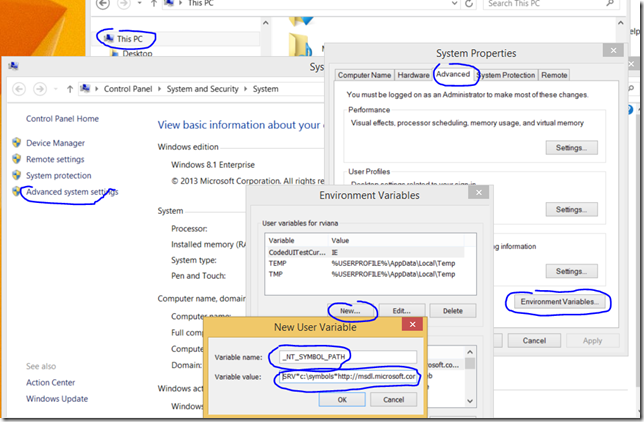
So, if you wish to follow my recommendation go to My Computer (or from Windows Explorer, right-click on “This PC”) | Properties | Advanced System Settings | Advanced | Environment Variable. Add this user variable (you have to have created the folder c:\symbols first):
Variable Name: _NT_SYMBOL_PATH
Variable Value: SRV*c:\symbols*https://msdl.microsoft.com/download/symbols
Loading NetExt in WinDBG
Depending on the target process or dump file bitness, open WinDBG 32 or 64-bits version. If you have no dump file to play with, you can download some along with the documentation here: https://netext.codeplex.com/documentation
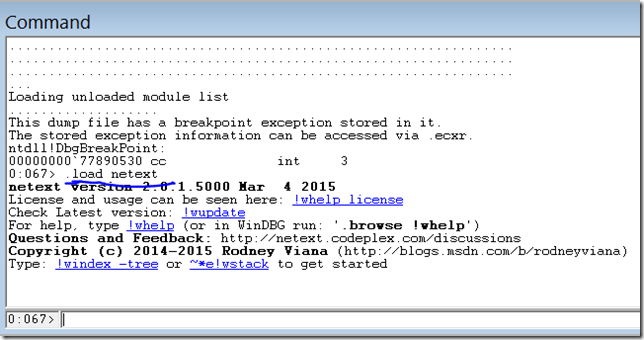
Having the extension in the right place, open the dump file (or attach to a .NET process). Run this command:
.load netext
To verify if you have the most up to date version, please run:
!wver
It will show you the .NET version loaded in the process (or dump) and the current extension version.
Checking all types in .NET heap
If you are new to the extension or to the type of process of dump you loaded, you may run this command to create a tree of the types in the heap:
!windex -tree
If you receive an error it is because you do not have the appropriate symbols or the bitness of WinDBG and the process (or dump) are not matching. If this is the case run .cordll –l to see why it is unable to load the .NET DAC.
If the command succeed then it will index the heap (which is necessary for all advanced commands) and it will also create a tree visualization file of all the types. When it finishes it will show you the command you have to use to see the tree. The file name will be different every time you run this command:
Copy and paste the command. It will pop up a new windows with all types. If you double click a type it will show a list of all objects of the type. If you expand a type and double click a field, it will show the value of the field for all objects of this type in memory:
Some cool stuff
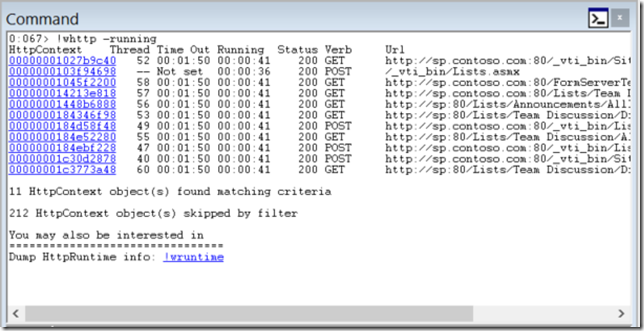
You can check all currently running http requests in a web application with this command:
!whttp -running
If you click on one of the addresses you will see the details of the particular request. Below is a listing showing a SOAP request (including the SOAP body):
For SOAP messages you also have the chance to show it XML-formatted or in tree style. The options are shown at the end of the command. The server variables are also shown when present so you can see the user making the request for example.
The extension also leverage a SQL-like command (and custom interpreter) to show heap object details based on a conditional and with several formatting options. The command is !wfrom. The command below will dump all HttpContext objects in the same format yielded by !whttp:
!wfrom -nospace -nofield -type *.HttpContext select $rpad($addr(),10)," ",$if(!_thread, " --",$lpad($thread(_thread.DONT_USE_InternalThread),4))," ",$if((_timeoutSet==1),$tickstotimespan(_timeout._ticks), "Not set "), " ", $if(_response._completed || _finishPipelineRequestCalled,"Finished", $tickstotimespan($now()-_utcTimestamp.dateData)), " ", $replace($lpad(_response._statusCode,8),"0n","")," ", $rpad($isnull(_request._httpMethod,"NA"),8), " ", $isnull(_request._url.m_String, _request._filePath._virtualPath)
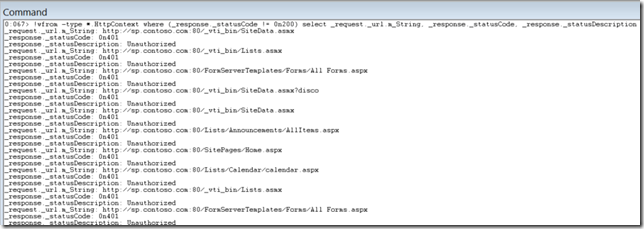
Don’t let this huge query frighten you. You will learn with experience. This is a more typical query without much complexity as the one above showing only requests that are not returning 200, Please note that the default base for numbers is hexadecimal, so to use decimal you must prefix it with 0n like we are doing with the 0n200 for the status:
!wfrom -type *.HttpContext where (_response._statusCode != 0n200) select _request._url.m_String, _response._statusCode, _response._statusDescription
Moving forward
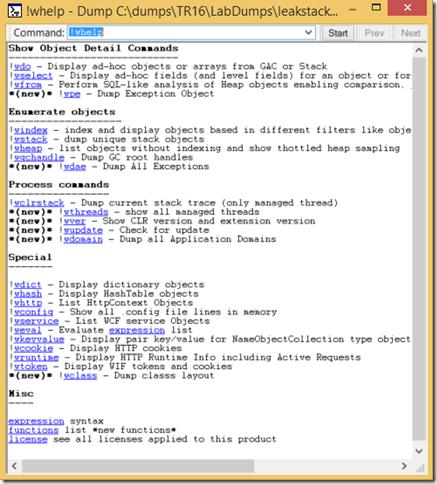
The best way to get detailed help is via command !whelp. For a more wiki like experience use the command below:
.browse !whelp
It will open a new window containing the hyper-linked help.
I strongly recommend you do the guided training: https://netext.codeplex.com/documentation
If you are novice or a hardcore debugger, you will only get going after the training.
Comments
Anonymous
March 10, 2015
Great work!!! Thanks a lot for sharing this plugin.Anonymous
March 10, 2015
The comment has been removedAnonymous
March 10, 2015
The comment has been removedAnonymous
March 11, 2015
The comment has been removedAnonymous
March 12, 2015
Hi Greg, Kudos for you. The extension (counting the time it was internal only) is around for about 4 years now, Until now you were the only one who noticed this. I meant GC heap as you suspected already. I will fix the text in next release.Anonymous
March 21, 2015
Excellent extension. Just made my job that much easier. It also re-introduced me to .cmdtree. (I had read about it years ago on Tess' blog)Anonymous
August 26, 2015
Just a side note. In your post and (codeplex) documentation you say the debugger for x64 is located in C:Program Files (x86)Windows Kits8.1Debuggersx64. But in my case it is (being still the 8.0 debugger): C:Program FilesWindows Kits8.0Debuggersx64 Otherwise interesting extension. Looking forward to use it on my next tough dump debugging. Although I usually don't get Web or WCF related issues. But sometimes its enough to get this little bit more on information that can tip you off on the cause. Keep it up please.Anonymous
August 26, 2015
Magellan, The folder changes with the SDK installed. Looking forward to hear about your experiences with the extension.Anonymous
October 27, 2015
Windex command seem to be not working on a crash dump. It simply gets into a non responsive state (BUSY in command window)Anonymous
October 27, 2015
Hi Sam, What is the output for these commands? !wver .cordll -lAnonymous
October 27, 2015
0:052> !wver Runtime(s) Found: 1 0: Filename: mscordacwks_Amd64_Amd64_4.6.81.00.dll .NET Version: v4.6.81.00 NetExt (this extension) Version: 2.1.0.5000 0:052> .cordll -l CLR DLL status: Loaded DLL mscordacwks_AMD64_AMD64_4.6.81.00.dllAnonymous
October 27, 2015
Sam, It seems the dump is ok which was my concern. What do you get if you run: !wheap If you want me to take a look at the dump you can send me the details via contact in the blog and I will take a look. First just send a contact request and when I reply you with my e-mail you can reply with the dump location info.Anonymous
October 27, 2015
!wheap returns a list of heap areas followed by a large list of objects. Most of them are either designated as <UNKNOWN> or BadPtr. It also says "This output was throttled. Only the first 500 objects of each heap range has been shown." Ex: 0000000529a5eaa0 fffffffffffffffc 1048600 2 3 BadPtr 000000052f2f1038 000007fe9993edd8 23736408 3 3 <UNKNOWN> 00000001ff2f97f8 000007fe99cb6f08 32 1 2 System.Collections.Specialized.NameObjectCollectionBase_NameObjectEntryAnonymous
October 27, 2015
So, there is a chance that one of the two things happened: a) this is not a full memory dump or b) It was taken during garbage collection. If this is the case, you should not get better results from sos. To test: .loadby sos clr !dumpheap -statAnonymous
October 27, 2015
It is not a full memory dump. It is the ASP.NET crash dump file generated when a worker process (W3WP.exe) crashes. I was able to run windex on a full user dump without any problem.Anonymous
October 27, 2015
Sam, Without module information it is not possible to get the metadata. For full managed debugging (i.e heap analysis), it is necessary a full user mode dump.Anonymous
July 13, 2016
Looks fantastic, thanks for sharing. Does this have .NET Core support?- Anonymous
July 17, 2016
I haven't tested yet, but it should. If not, just add an issue in codeplex and I fix it.- Anonymous
April 19, 2017
Hey buddy,Just wanted to say Hi.Also, thanks for everything.- Anonymous
April 25, 2017
Hey Craig,Long time no see. Hope you are doing well.
- Anonymous
- Anonymous
- Anonymous

