Write Faster Code with VS 2010 Profiler
Well, Visual Studio 2010 Beta 1 is finally here!!! WooHoo. As you may have seen in Brian Harry’s blog , we have added quite a few new features to Profiler to help you write faster code. The following is a list of the new features. In this list, I have also included a note on which features work for managed versus native (where applicable, of course). By the way, this is just an overview and we’ll be drilling into the details on these features in the weeks ahead:
Virtualization support for sampling (VPC, Hyper-V, VMware)
You can now use VS 2010 Profiler to sample profile an application (both native and managed) on a virtual machine, irrespective of whether the virtual machine was created using VPC, Hyper-V or VMware. The timers used for profiling are different on virtual machines than raw hardware, and I will elaborate more on this on a future blog post. By the way, all the screenshots you see below have been gathered on a Hyper-V virtual machine while sample profiling the Dinner Now and Beer House applications.
New Summary and Function Details reports
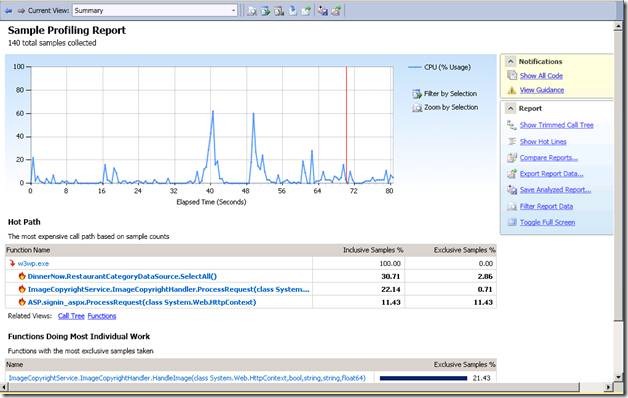
The Summary page has gotten a “total makeover” and is a lot more actionable than the summary page in VS 2008. The data on the summary page is going to look different depending on the method of profiling you choose, but regardless of the method of profiling, you can visually identify the performance spikes in your application and navigate to the top 5 methods by just a click.
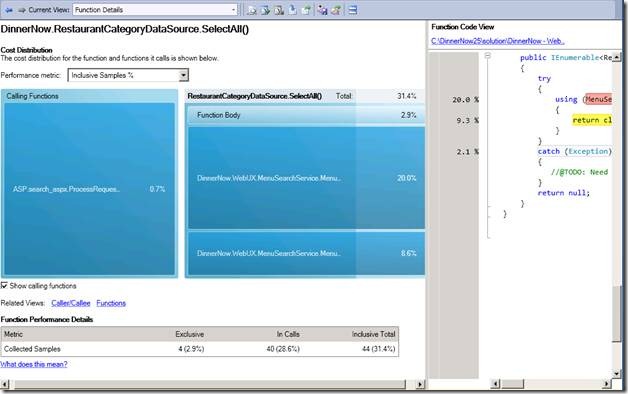
VS Profiler 2010 includes a new page called the Function Details page. The following is a screenshot of the Function Details page, which will depict the caller/callee information in a graphical way along with the performance metric. There is also an embedded, editor which includes the line-level performance measurements.
Both Summary and Function Details pages are available for managed and native applications.
Tier Interaction Profiling (TIP)
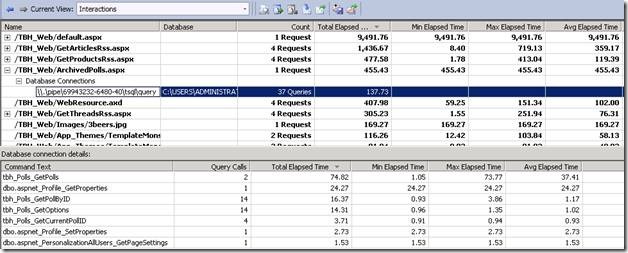
Tier Interaction Profiling (TIP), enables you to see the number of times a query (or stored procedure) was executed in your application, and to see the amount of time you spend inside of ADO.Net for that query. This feature is turned on via the session and target property pages, and once it is run, you will see an additional profiler report called Interactions (see below). As this feature only works with ADO.Net at the moment, it is only supported for managed applications. And, by the way, if your application is a web application, TIP also shows you the number of times a page was called and the processing time for that page:
Client Side JavaScript Profiling for IE 8
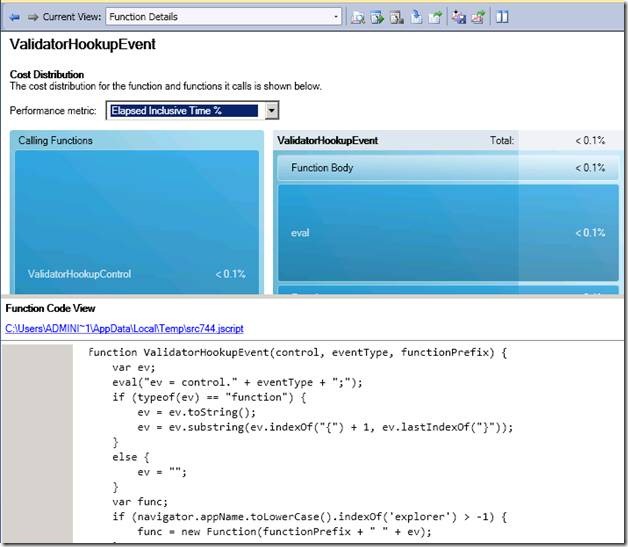
When incrementing a web application, you can now turn on JavaScript profiling via the session or target property pages to see the performance of your client-side JavaScript (including Ajax calls back to the web server). JavaScript functions will be included in your report alongside the methods from your web application.
Concurrency Profiling
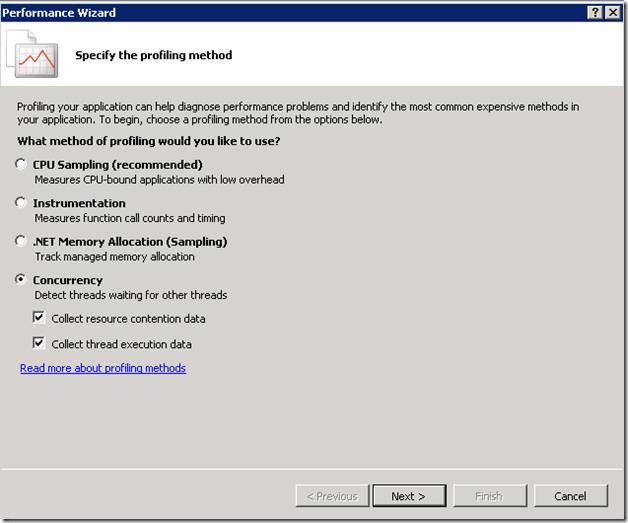
Concurrency profiling is a new method of profiling added to VS Profiler 2010 enabling you to profile your multi-threaded applications to see how your threads are behaving inside the application. There are two sub-modes for Concurrency profiling, which I will elaborate more on during a future blog post. Screenshot below shows the place in performance wizard where you can select concurrency profiling. Suffice to say for now that there is lightweight “Resource Contention” profiling and a more comprehensive “Thread Execution” profiling, each of which adds their own reports to profiler results. This feature works for both native and managed applications.
Just My Code
Have you ever wanted to exclude framework related information from your profiler reports so that you can look only at the data related to your code? You can now, with Just My Code feature. Just My Code reduces the noise in your profiler reports by removing framework related measurements. Just My Code works for both native and managed and applies only to sampling mode (in Instrumentation you specify the binaries you wish to profile, so it is “Just My Code” by default). There will be more detailed information on Just My Code to come in future blog posts from Profiler team.
CLR 4.0 Attach
When profiling applications written using .Net Frameworks 3.5 and below, some environment variables need to be set in the process. The Visual Studio IDE does this for you, but when profiling with the command line tools, you need to set up the environment variables using VSPerfCLREnv.cmd. In Dev10, you can attach directly to any v4.0 managed process to do Sample profiling using VSPerfCmd.exe /attach:PID.
Rich integration with the editor
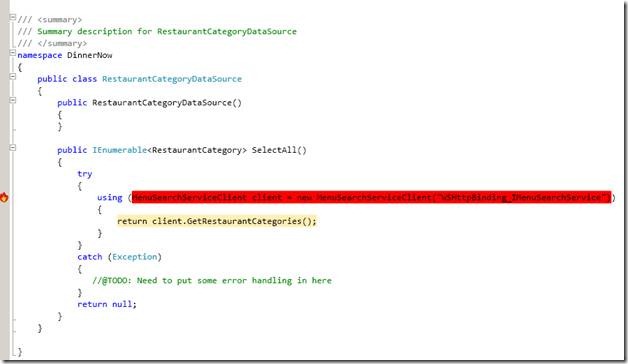
Rather than me writing about what it does, why don’t we just look at the screenshot below:
As you can see, the code is color coded depending on the performance data collected (in this case, the hottest line). Editor integration is available for both native and managed applications.
Built-in Rules and Guidance
VS 2010 analyzes the performance data collected during the performance run and will use pre-defined rules to recommend a few areas for further investigation. These recommendations will be displayed in the “Error List” in Visual Studio (double clicking the warning will bring you to the profiling data that triggered the rule or a help document about the rule). You can modify and expand upon these “Rules and Guidance” by writing your own rules (another blog post to be provided in the near future). The rules are available for both managed and native applications.
Comments
- Anonymous
June 12, 2009
Brian Harry on The Future of eScrum and Trial TFS with TeamDevCentral Marcel de Vries on How to fix Team
