Transposing rows and columns in SQL Server Integration Services
Okay, this was a rough one. The challenge was that a customer had Excel spreadsheets where we needed to transpose the rows and columns. In other words, the spreadsheet looked like this:

But we needed the records to list Program values by date, like this:
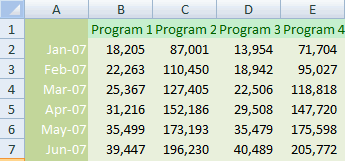
Of course, I did that by simply copying the cells and doing a "Paste | Transpose" in Excel. But when you have several hundred spreadsheets being used by folks, that's a nontrivial operation.
At first it looked like my only option was going to be writing a script in a Script Transform component - there's no "transpose" component in SSIS. But every time I asked someone about this, their first response was the Pivot component, which wasn't quite right. Today I ran across some comments on the Unpivot component, and something about the output called to me:
.gif)
And suddenly I figured it out - I could unpivot the spreadsheet, then pivot it again on the other field. Voila! A transpose.
So let's walk through this. I'm going to skip many of the SSIS basics - if you need help with SSIS, check out the tutorials here.
First, let's set up our Excel spreadsheet. This is the one step you really need to do - set a table name on your data. Click and select your data range, including the headers, then type a name into the Name box in the top left:

Hit the "Enter" key then save the spreadsheet. (Note: Save as Excel 95-2003; SSIS doesn't do Office 2007 yet)
Add a data flow task to a new SSIS project. In the data flow pane, add an Excel source pointing to the ProgramData table in the spreadsheet we just saved. If you preview the data, note the date columns have column names of F2, F3, F4 - the date values of 1/1/2007, etc don't map as column names. So let's go to the columns pane in the Excel source editor and give them intelligent names:

Next we're going to add an Unpivot transformation component and link our Excel Source to it. Double-click on the Unpivot component to open the transformation editor. Then you'll check each of the boxes to the left of each of the month columns which adds them to the "Input Column" list. For each of them you'll enter "MeasureValue" as the Destination Column. Finally, enter "MeasureDate" as the Pivot key value column name at the bottom:
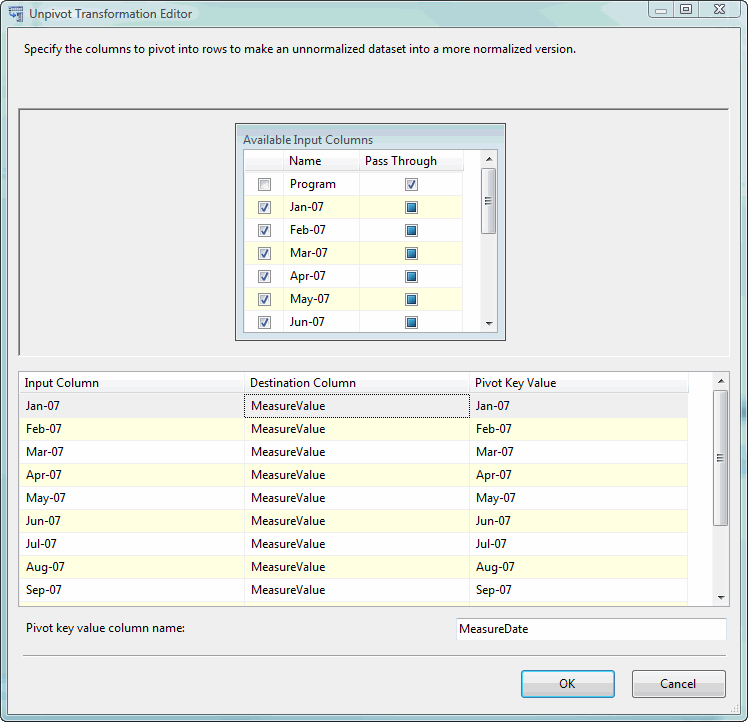
The output of this transform will look like this:
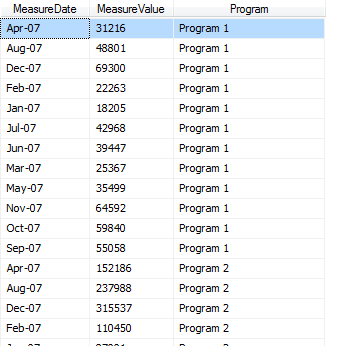
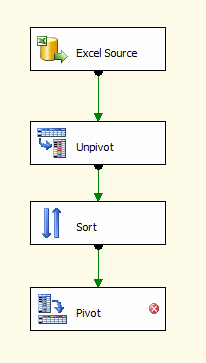
The next step is a bit of trickery - due to the way the Pivot transform works, we need to sort the output of the Unpivot transform so that the appropriate records will be adjacent, otherwise you'll get a staggered output. Add a Sort Transformation component and connect the Unpivot output to it:

Configure the Sort Transform to sort by the MeasureDate column.
Now let's add a Pivot transform and connect the output of the Sort component to it:
Now comes the really tricky part - configuring the Pivot component. Double-click on it to open the Advanced Editor. In the Component Properties tab we don't have to change anything.
Open the Input Columns tab. Check all three available input columns. That's all we have to do here.
Open the Input and Output Properties tab. Open up the Privot Default Input and Input Columns folder. Select "MeasureDate." Note the LineageID number here - we'll need that later. Set the PivotUsage to "1". The PivotUsage indicates to SSIS how to use each column:
- 0: Row Attribute
- 1: Row ID
- 2: Column ID
- 3: Values
So MeasureValue gets a PivotUsage of 3, and note its LineageID. Program gets a 2.
Now let's create our outputs - open up the Pivot Default Output and click on "Output Columns"
Click on the "Add Column" button at the bottom. Our first column is going to be the MeasureDate - set the name to "MeasureDate" and the SourceColumn to the LineageID of the MeasureDate input column.
Now we're going to add the four columns for our four programs. Click on the Output Columns again (if you have "MeasureDate" highlighted when you add a column, it will be inserted above MeasureDate. There's no way to rearrange columns once you create them. It's not a huge deal, but if you're aesthetically nitpicky...).
Once you have "Output Columns" selected, click the "Add Column" button. Name the new column "Program1" (no space). We're going to have to create a column for each value we want to transpose - this is one place that makes this fragile; you're going to have to be sure to set up your error checking in case someone adds a new Program.
This column is going to get values from any row where the Program column has the text value "Program 1" (with space). So put the LineageID for the MeasureValue input column into the SourceColumn field (this indicates where the value will come from). Then type "Program 1" in the PivotKeyValue field. (Or better yet, copy/paste from the spreadsheet itself).
Add columns for Programs 2, 3, and 4 the same way - make sure to select "Output Columns" before adding a column, and the source column will be the same for all four programs.
Now let's add an Excel output to view the results - use the Excel Destination Editor to create a new connection manager with the default outputs after you connect the Pivot:
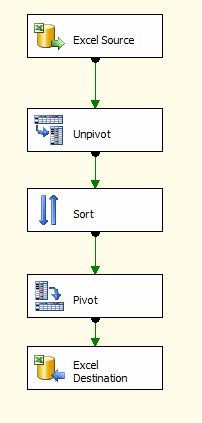
When you run the package, here are the results you'll get in the Excel spreadsheet you configured as the output:

Note that the dates are sorted alphabetically, as the result of our sorting to group the results. If you're inserting the output into a database, it shouldn't matter. Alternatively you can use other transforms to translate the date column (which is currently a string) into a proper date and sort the dataset again.
Again, a word of warning that this is a bit fragile; our dates are coded in the original source and unpivot, and the programs are listed in our pivot transform - be sure to use robust error checking and reporting. But it's definitely easier to work with and maintain than a script component!!!
Comments
- Anonymous
June 19, 2009
PingBack from http://mydebtconsolidator.info/story.php?id=17014