What is my Microsoft Operations Management Suite data usage?
Summary: Learn how to easily find your data usage for the various Microsoft Operations Management Suite solutions.
Good morning everyone, Ed Wilson here. Sometimes you are driving along, and you take a wrong turn and end up in the woods. The street signs disappear, and all of a sudden even the GPS doesn’t seem to know where you are. This happened the other day when the Scripting Wife and I were out—all of a sudden we came to a fork in the road and we took it. After a few more turns, it was like a real life Rubik cube. Here is a photo I took:

Data usage with OMS
Some people seem to feel like they are lost when it comes to cloud offerings. They are unsure as to their utilization and data needs; and therefore, they feel like they are in an uncertain environment.
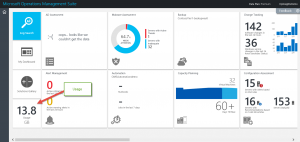
In the lower left corner of my Microsoft Operations Management Suite home console, there is a number. For me, it shows 13.8 GB of usage:

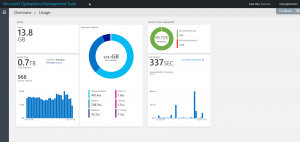
When I select this tile, it tells me a number of very interesting things. It says, for example, that I have used 13.8 GB today. That is the same number I saw on the live tile, so it is no surprise.
Two things that are a bit more interesting are the Last 30 days figure and my Usage per Solution tile. There is also a Service Level Agreement (SLA) tile that tells me that I have been within 99.75% of the SLA with an average batch processing time of 337 seconds.
The coolest thing is that it tells me I have used 0.7 TB of data in the last 30 days, and that I have 968 servers utilized. I also have a nice graph that shows my daily data utilization over the last 30 days.
The next cool information I can dig into provides me with insight into my data usage per solution. For example, Log management is 418 GB, Capacity planning is 1.8 GB, Security if 208 GB, and Wire Data is 42 GB. To be honest, I kind of figured that Wire Data would have taken more data. So the results are somewhat surprising—at least to me.
This usage overview screen is shown here:
That is great news. With the insights I can gain from my data usage, I can make more intelligent decisions. It provides a map that I can use for planning.
That is all I have for you today. Join me next week when I will begin a series about near real-time performance counters in MS OMS.
I invite you to follow me on Twitter and the Microsoft OMS Facebook site. If you want to learn more about Windows PowerShell, visit the Hey, Scripting Guy! Blog. If you have any questions, send email to me at scripter@microsoft.com. I wish you a wonderful day, and I’ll see you tomorrow.
Ed Wilson
Microsoft Operations Management Team
Comments
- Anonymous
February 14, 2016
Unfortunately it can't tell which servers are contributing to data, as in which servers are uploading the largest amount of data. - Anonymous
September 14, 2016
Is there any way to differentiate between data uploaded, and data stored? This only seems to represent the latter. The former is still very interesting to me. It's important to understand the impact to the network.
