Use OMS Search to visualize collected performance data
Summary: Drill in to a graph that shows metrics about your computer with OMS near real-time performance counters.
Good morning everyone, Ed Wilson here. The other day, we went to Blue Spring State Park to see the manatees that winter there. During the off season, evidently, they open the spring for swimming. However, there is a catch…there are alligators. Here is the sign:
I have gone scuba diving with sharks, but I don’t think I would want to swim with alligators—and I certainly don’t think I would hold out a Twinkie or something else to feed said alligator.
Note This is a five-part series that includes the following posts:
- Near real-time performance data collection in OMS
Learn about setting up and using near real-time performance data. - Add counters to near real-time data collection in OMS
Learn how to add various counters to near real-time performance data. - Use OMS Search to visualize collected performance data
Drill in to a graph that shows metrics about your computer. - Filter OMS near real-time performance counter data by computer
Use Log Search to filter near real-time performance counter data by computer name. - Use OMS near real-time performance counters to check one counter
Check the status of a single counter across all your systems.
Sometimes when monitoring our systems, it may seem a bit like swimming with alligators—that we need to be really careful. I have seen situations where the burden of collecting performance data actually caused a significant drag on an otherwise perfectly performing machine. This is where OMS near real-time performance counters comes into play.
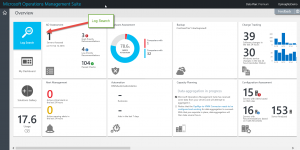
Like lots of things in MS OMS, I need to use the log search capability. To do this, I access Log Search from my home console:
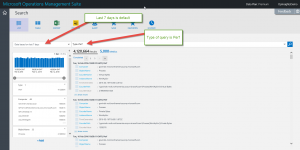
On the Search screen, I begin by adding my type of search. The type is perf, so I use the following query:
Type=Perf
By default, data returns from the last 7 days. Here is the command and the output:
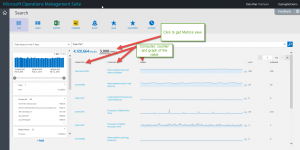
When my performance data returns, I can change the view from detailed records to a visualization of the raw results of the metrics. This is not exactly an intuitive thing to do, but it is easy. All I need to do is to select the Metrics word.
When I do, I get computers, counters, and a graph. It shows the last reading and the average reading. The difference is that now Metrics is underlined and in black, and Results is now in blue, which indicates that I can click it:
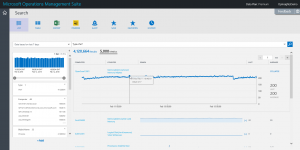
From the Metrics view, I can dive into the graph itself. I click the graph, and it opens with dates of the readings, the computer name, a counter, and averages. This expanded view is shown here:
If I hover over a particular point on the graph, perhaps at a peak, I can see the specific value and date time of the particular reading. This is great for honing in on anomalies in my system’s performance.
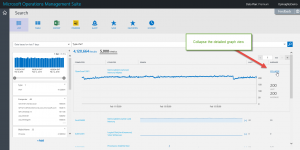
When I am done with the detailed graph view, I click the Collapse blue word, and it returns to my original view:
That is all I have for you today. Join me tomorrow when I’ll talk more about near real-time performance counter data.
I invite you to follow me on Twitter and the Microsoft OMS Facebook site. If you want to learn more about Windows PowerShell, visit the Hey, Scripting Guy Blog. If you have any questions, send email to me at scripter@microsoft.com. I wish you a wonderful day, and I’ll see you tomorrow.
Ed Wilson
Microsoft Operations Management Team
Comments
- Anonymous
February 17, 2016
Off topic:Is it a possibillity that OMS can coexist with Ops Mgr.? :) - Anonymous
February 17, 2016
@Cloud-Ras Yes, System Center Operations Manager and Microsoft Operations Management Suite can co-exist ... and quite nicely too. Here is a link to an article that talks about how to do it: https://technet.microsoft.com/en-us/library/mt484104.aspx

