Use Microsoft Operations Management Suite for capacity planning
Summary: Ed Wilson talks about using Microsoft Operations Management Suite for capacity planning.
| If you have the current Capacity Management Solution, you can continue to use it, but it is no longer available to be added because it is being updated. This article talks about the new solution: https://azure.microsoft.com/en-us/documentation/articles/log-analytics-capacity/. |
Good morning everyone. Ed Wilson is here. I’ll tell you, I love the smell of Bergamot in the morning—especially late morning. Bergamot, as you may know, is one of the essential oils in Earl Grey tea, which is my mom’s favorite tea, and the one tea that I grew up on as a kid. Now that I am back in central Florida (where I grew up), it is winter, and I am sipping an especially fine cuppa…well it brings back strong memories of a simpler time.
This morning I was listening to AC/DC and I thought, “Dude, that sounds like Cloud and Datacenter Management MVP, Sean Kearney.” Then I realized why. It was because of the video he created several years ago. Check it out: Highway to PowerShell - Part IV - A New Hope.
Easy capacity planning with OMS
When I was in consulting, one of the things I enjoyed was capacity planning. It was actually pretty complicated because it involved lots of performance monitoring over an extended period of time. Then based on historical trends, I could extrapolate when a particular resource might run out.
I remember one particular customer that I did this for. Based on the trends, we added disk space and memory. The processor utilization was OK. After the upgrades, I told the customer that the server should last for another year. What was really cool was that 14 months later the customer called complaining about the performance of that server. I had timed it nearly perfectly. It took a decent amount of analysis over a decent amount of time to pull that one off. But it was cool.
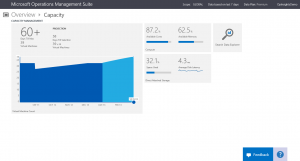
With MS OMS, this is really easy to do. I select the Capacity Planning tool from the Overview page in Microsoft Operations Management Suite:
One of the cool things about the Overview page is that, well…it gives me a good overview. I can see at a glance that I have 87% available cores, 62% available memory, and 67 percent available storage. The tile also changes, so from time--o time, it tells me that I am running 39 virtual machines and that I will reach my maximum capacity in 62 days. It is tracking my utilization over time. Cool!
Detail drill down
When I select the Capacity Management tool, I can drill down into it. The largest area tells me the projection, which is exactly what I would want to know immediately when doing capacity planning and management. It tells me I have 60+ days until my 39 virtual machines reach capacity. The projection gives a bit more information: 58 days and plus or minus 14 more virtual machines.
I am also using 87of my available cores, 62 percent of my available memory, and 32 percent of my space. I have an average disk latency of 4.3 milliseconds. All this information is shown in the following image:
Processor cores and available memory
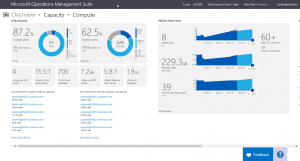
I select the processor cores and available memory from the Capacity Management Overview screen, and I am presented with detailed utilization information. I can see that I am using an average of 3 Vcores per VM and I have 705 available cores! I am using an average of 7.2 GB of vMemory per VM and I have 1.9 TB of available vMemory. WooHoo!
I can also see at a glance that opsinsights05.contoso.com is my highest core utilization site and it is only using 28.4 percent. I am really in good shape here.
On the other hand, the same server is using 94.3 percent of the memory. This could be a problem depending on what apps it is running. Here is this screen that shows these details:
Like some of the MS OMS solutions, I can open this information in Microsoft Excel by clicking View all in Excel. Here’s the information in an Excel spreadsheet:

I can easily parse this information in Windows PowerShell. I talk about this in Use PowerShell to Work with Data from MS OMS on the Hey, Scripting Guy! Blog.
Direct Attached Storage
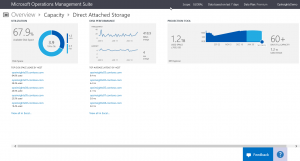
If I select Direct Attached Storage from the main Capacity Management screen, I am taken into a storage deep dive. I can see, for example, that my top disk space usage is from opinsights03.contoso.com, and it is using 84.8 percent of my storage. But my average disk utilization is 67.9 percent. I also see that I am getting an average of 418.9 MB/s throughput, and that I have an average latency of 4ms. Opinsinsights03.contoso.com has the top average latency of 6.4 ms. This information is shown in the following image:
Once again, I can select View all in Excel and see all the data in an Excel spreadsheet:

That is all I have for you today. Join me tomorrow when I’ll talk about more cool Microsoft Operations Management Suite stuff.
I invite you to follow me on Twitter and the Microsoft OMS Facebook site. If you want to learn more about Windows PowerShell, visit the Hey, Scripting Guy! Blog. If you have any questions, send email to me at scripter@microsoft.com. I wish you a wonderful day, and I’ll see you tomorrow.
Ed Wilson
Microsoft Operations Management Team
Comments
- Anonymous
May 22, 2016
Hi there, how do you get the capacity planning option to show up in the overview page? I've just setup a new OMS account but don't have this functionality, it's also not available as a solution.Cheers- Anonymous
May 22, 2016
Oh never mind, I see this is an SCOM specific feature, not for agents directly attached to OMS :(
- Anonymous


