Export OMS data to Power BI -- now available in Public Preview
Summary: Today we have a step-by-step post about how to export Microsoft Operations Management Suite (OMS) data to Power BI.
Hello, this Alex Frankel from the Microsoft Operations Management Team.
Exporting data to Power BI has been a popular ask from a lot of you for a while now. Power BI has built a fantastic set of data visualization tools, and you can unlock some pretty powerful scenarios by using OMS as a data source. I’m happy to announce that this capability is now available in Public Preview. Just go to Settings > Preview Features to enable it.
Why do I want to export data to Power BI?
While OMS solutions are a great way to visualize data, Power BI has a rich and mature set of data visualization tools that allow for deep customization of a dashboard.
On top of this, Power BI makes it really easy to share dashboards, so this is a great way to share a subset of data with only a specific set of team members.
Heads up: Power BI is offered in two different pricing tiers. The free pricing tier allows you to consume 10K rows of data per hour, while Power BI Pro will let you consume 1M rows per hour. For full details, visit Power BI’s pricing page.
Sounds cool! How do I set this up?
The good news is that setting this up is really easy.
1. Enable the Power BI Public Preview.
Simply go to Settings > Preview Features, and set the Power BI Integration switch to Enabled.
2. Sign in to your Power BI account in OMS.
Go to Settings > Accounts > Workspace Information, and select Connect to Power BI Account, which will open a browser window. Sign in with your Power BI credentials.
After a successful sign in, you’ll either see a confirmation message, or the window will close automatically.
3. Craft your search query.
Choose a query that has data you’d like to send to Power BI. You can do this by writing a query from scratch or from a solution.
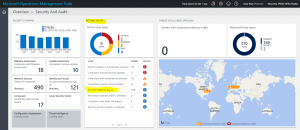
I’m going to get my search query bydrilling down within the Security and Audit solution. In this example, I’ll just select Accounts failed to log on underneath the Notable issues blade.
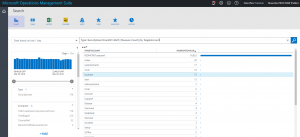
You’ll notice the query box contains the query that is used to populate the tile in the corresponding solution.
Because this query has a | measure count() by TargetAccount at the end, I’m not returning the raw results. I’ll be able to explore my data better in Power BI if I use the raw results, so I’m going to remove the | measure count() by TargetAccount command from my query, which leaves me with this:
Type:Update (Classification:"Security Updates" OR Classification:"Critical Updates") AND UpdateState=Needed AND Optional=false AND Approved!=false
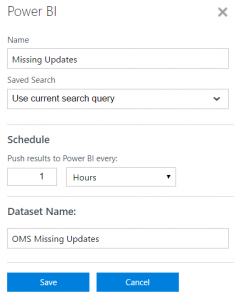
4. Select the Power BI button in the task bar and configure your export.
Simply name your export rule, choose how often you’d like to send the data (hourly report, daily report, etc.), and name the dataset, which is what you’ll see in Power BI.
At this point, OMS will send any new data to this dataset. One limitation of the Public Preview is that you cannot export historical data.
5. Confirm a successful push to Power BI.
Go to Settings > Power BI to view all your Power BI export rules. The Sync status column will show successful and unsuccessful pushes. You can view the detailed results in search by selecting either of the blue links -– this can be useful if things aren’t working properly. After you see a success message here, you should be able to see your new dataset in Power BI.
6. Explore your dataset.
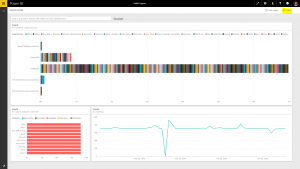
At this point, data is flowing to your Power BI workspace. You should see the name of your dataset on the left sidebar. Select your dataset name, and then open the Count and Results dropdown in the Fields sidebar on the right.
What you see in this list depends on your search query. When we send data to Power BI, we simply send the same raw data you are viewing in OMS. That means that whatever fields you can see in OMS, you should see within your Power BI dataset.
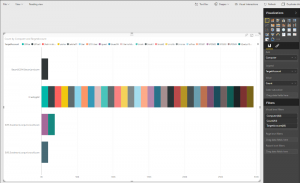
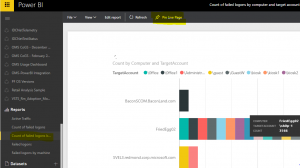
To create this chart, which shows me on the number of failed logons per machine, I included the Count property from the Count section and the Computer and TargetAccount from the Results section.
7. Visualize data and save it to a report.
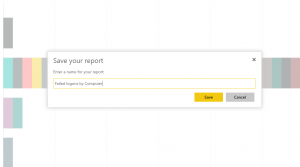
When you’re happy with how the data looks in the dataset, go to File > Save As. This is where you’ll name your report. After you save this data as a report, it can be pinned to a dashboard.
8. Create your dashboard.
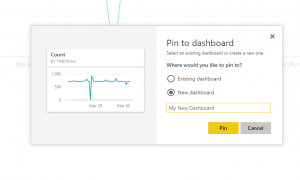
When you select the pin icon on any chart in a report, it will ask you which dashboard it should go to. At this point, you can choose to create a new dashboard.
9. Share your dashboard!
Take advantage of the sharing capabilities of Power BI. Simply select the Share button to invite others to view your dashboard via email.
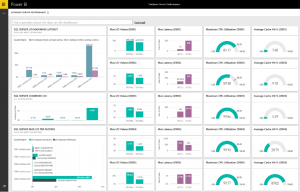
At this point, the sky is the limit on what you can create. Below is a one of our more complex dashboards to monitor SQL Server database performance:
Anything else you’d like to share?
We’re really excited for you all to get your hands on this preview. There are a few items at the top of our list, such as Groups support and exporting of historical data, that we’ll be working on as we move this feature to General Availability.
As always, the best thing you can do is keep me posted about how your experience is going. Post new feature requests to UserVoice, respond to the monthly survey we send via email, and if you want to reach out you can email me at alfran@microsoft.com. Happy exporting!
Alexander Frankel
Microsoft Operations Management Team
Comments
- Anonymous
April 06, 2016
I have been drooling over this feature and am excited to try it out!!!- Anonymous
April 07, 2016
@David Yeah, it is pretty awesome. I am planning on doing some blog postings on this in the near future. Stay tuned.
- Anonymous
- Anonymous
September 21, 2016
Tried to perform same steps as instructed, but due to personal ID like Hotmail does not accept for Power BI. Is there any other way around to connect to, also external data can we pull in Power BI per automation ? - Anonymous
December 28, 2016
For shared workspaces, is it possible to connect more than one PowerBI account? - Anonymous
January 31, 2017
The comment has been removed - Anonymous
April 13, 2017
When using OMS and Power BI together, OMS is the data collection layer, Power BI is the visualization layer. Where should the data processing happens? Based on what I tested so far, since the oms is push the query data directly to power bi service and there is not much data modeling (such as run dax to create column and measures) is that mean all data preparation should be done through OMS query? Any plan to make OMS Data Repository a data source for power BI desktop so we can using the data from OMS combine with other data source build better dashboard? - Anonymous
June 28, 2017
Two of the other comments in this discussion thread kind of touch upon the fact that there is no defined data model supplied with data sourced from OMS through the PowerBI connector. This is limiting, I really want to perform some very basic queries within Power BI to link various reports. However, without the model I can't does anyone have a decent approach for this (where I don't have to export data directly - I like the refresh direct to Power BI) - Anonymous
July 10, 2017
I have this configured in OMS to push 2 datasets to Power BI. Sync status says the two datasets were uploaded correctly, and if I click on the SyncStatus I can see the first dataset had 62 rows and the second 60 rows (that's what the search queries returned as well).On Power BI only first dataset is populated and the second dataset is empty.In this case the Power BI account being used is a free account - could that be causing the restriction?I've done this many times before using Power BI Pro accounts - its frustrating that there are no errors reported in the case where only 1 dataset makes it to the Power BI dataset.
