Viewing Optimization Passes in the DirectX Shader Compiler Editor
A few days ago I showed how we can compile and disassemble a shader using the DirectX Shader Compiler Editor, then how to run that shader. Today I'm going to look at the optimizer instead.
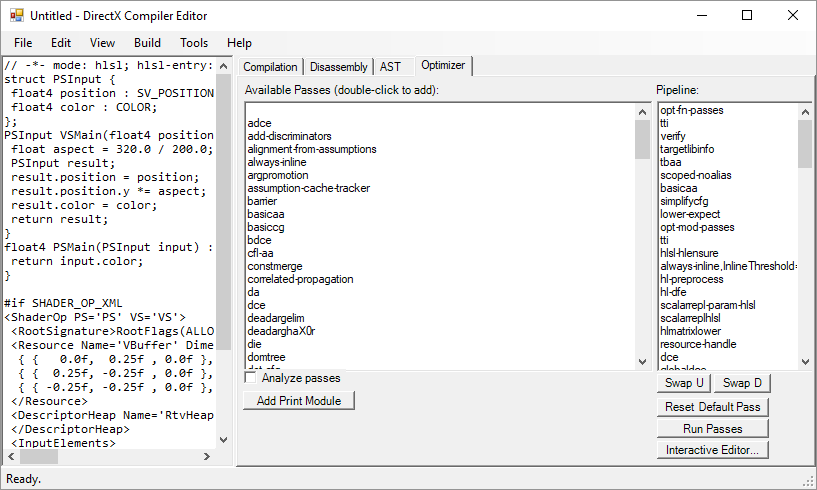
We're starting again from the stock program available via Ctrl+N, and then when we click on the Optimizer tab, this is what we get.

On the left, we have a list of all the available passes in dxcompiler.dll. We get this via the IDxcOptimizer interface.
On the right, we have a specific set of passes forming a pipeline of optimizations. We get these via the IDxcCompiler interface using the /Odump argument, which produces a list of the optimization configuration used. This also takes into account other arguments such as /Od or /O1.
You can play with the passes by moving them up or down in the pipeline, adding new ones or removing existing ones, or even changing properties by right-clicking on them and selecting Properties. This is only enabled for very few passes at the moment, but we'll add more as we need them.
Another handy thing to do is to right-click on the pipeline and select Copy All. This copies to the clipboard the pipeline configuration in the same format you would use with the IDxcOptimizer interface.
When you click Run Passes, the output of the optimizer run is displayed. This may include the disassembly if you have any print-module passes.
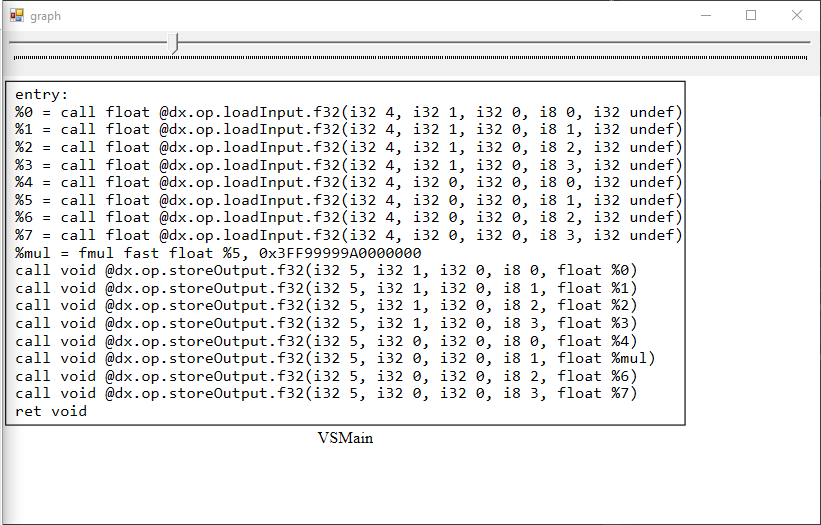
If you used the view-cfg pass to dump a GraphViz-formatted , note that you can right-click on the graph keyword in the output and select 'Show Graph'.

This will bring up a new window with an SVG render of that graph if dot.exe can be found. You'll get a list of probed locations if that's not the case.

The graph would be more interesting if I had some control flow of course. You can zoom in and out using the slider at the top.
Next time we'll explore the Interactive Editor button on the Optimizer tab.
Enjoy!