Poor-Man's Profiler
Microsoft's C/C++ compiler supports the /Gh and /GH switches, these options allow the developer to inject a function call into the beginning and exit of every procedure being compiled. Aside from enabling some cool logging/traceability scenarios, you can also utilize this functionality to build in a simple profiler.
There have been a (surprisingly large) handful of times when I haven't had a profiler available, either due to the fact that one simply didn't exist for the platform I was working on, or a licensed copy of one wasn't readily obtainable. As such, having a simple profiler library ready to link into a project has been a welcome and useful addition to my toolbox.
Here is the basic outline of what needs to happen to pull this together. Also note that the discussion here assumes a 32bit Intel architecture. If you are on a 64bit or a non-Intel compatible platform, you will have to forgo the inline assembly, and supply the _penter/_pexit functions in a stand-alone assembly module.
1. Provide a _penter function
Per the example referenced in the /Gh documentation, you will need to link in your own _penter function which utilizes the naked calling convention. Because of this (and not shown in the official example), you will need to adjust the stack pointer to account for any local variables you use. For example, assuming we use 24 bytes of local stack:
// adjust our stack pointer for local variables
mov ebp, esp
sub esp, 24
In this function you will want to grab the return address off the stack (which will be used to identify the caller) and take a snapshot of the time. To store these values, you will need to use a stack-like data structure so you can keep track of the start times for all the functions in the current call chain. Have each thread utilize its own storage buffers for the timing stats, the last thing you want to do is introduce a deadlock with your profiling code (or corrupt memory if you don't protect yourself).
To get the time, use a high resolution clock. I would recommend either calling QueryPerformanceCounter() or invoke rdtsc from assembly if you can account for/mitigate the issues around using it directly.
2. Provide a _pexit function
In your custom _pexit function, grab the current time so you can calculate the run-time. Since file IO is very slow, write out the caller's address and the elapsed time to a separate buffer in memory.
Warning: If your _penter or _pexit functions call any other functions or methods (such as the above mentioned QueryPerformanceCounter), make sure those are not compiled with /Gh or /GH. Otherwise death by recursion will ensue.
Depending on how much run-time overhead you want to deal with, you can also add additional code to keep track of:
· hit counts (how many times a function is called)
· minimum and maximum times spent in a function
· the amount of time spent in calls to children
3. Write an "at end" function
Since our timings are still in memory, we need to provide a function which will be called at the end of the application to write the results out to a file.
4. Post-Processing
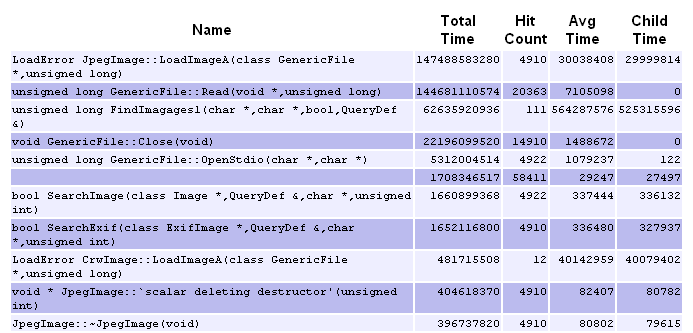
Write a tool to translate the caller addresses into the actual function name. This can either be a separate application or done within step 3 above. To do the translation, you can either utilize a map file or use the PDB APIs. Then it is just a matter of providing the results in an easy to view/sort manner. Below is a screen shot of some results taken from an application which searches through the metadata in photos (times shown are in clock ticks to avoid rounding or truncation issues, and in this specific sample, there happens to be 2175.21 ticks in a microsecond).
