Specialized Performance Troubleshooting (Part 3: How to identify storage issues at a SQL Server box)
This week I will explain how to detect and analyze storage performance issues.
The first step is to collect a Perfmon trace and check these two counters for each disk:
Physical Disk: Avg. Disk Sec/Read
Physical Disk: Avg. Disk Sec/Read
The recorded values should be less than 20 msec for attaining good performance.
They will have to remain below 40 msec at all costs, otherwise performance can get impacted.
The next step is to find out which process causes this IO. So we will record values for these counters and for each process:
Process: IO Read Bytes/sec
Process: IO Read Bytes/sec
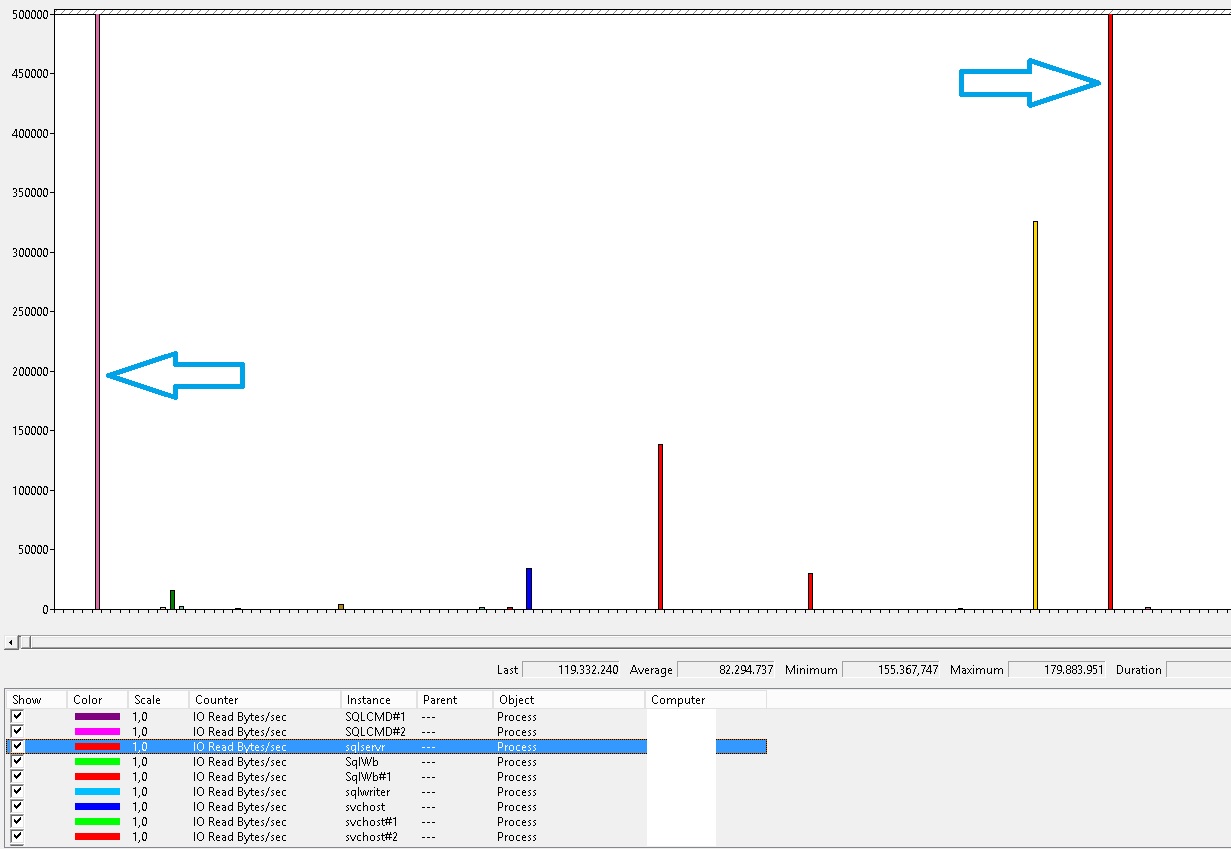
If you then load the results into Perfmon as a histogram bar, you can easily identify the process that touched the most bytes. In my case it was sqlservr.exe:
In other cases, I have seen 3rd party applications being responsible for the high IO workload, while everyone thought it was the SQL Server process that caused the disk performance.
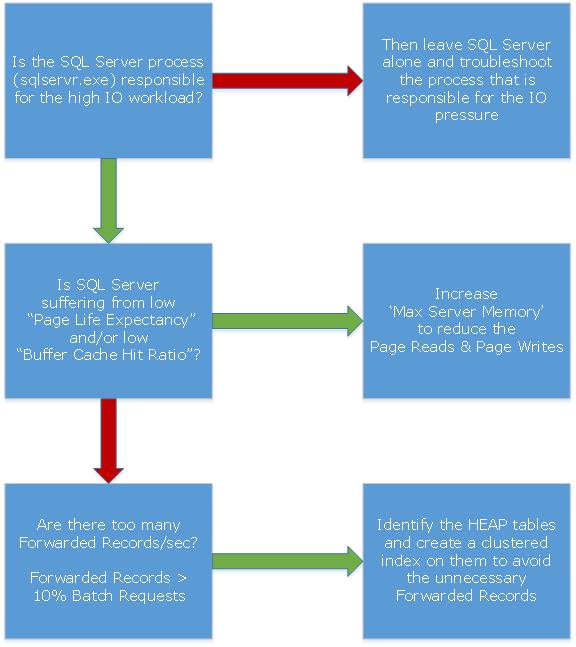
I will summarize the usual checks in a decision tree:
Of course not all storage problems can be summarized in a blog post but these are the ones I typically encounter the most.
Next week's topic will not be about performance: "Default values of SQL Server that you possibly want to change after installation"
Stay tuned!

