Perfview Command for Capturing Automated High CPU Dumps
CPU utilization plays a vital role in the performance of your application. When it comes to web applications which are expected to run round the clock, the impact caused by a CPU spike will be catastrophic as the responsiveness of the application will get worse when there are not enough CPU resources to consume.
There are so many tools which were used to perform the high CPU troubleshooting.
For most of the high CPU problems we would need to capture a memory dump to get to the bottom of the issue,the most conventional way to capture a memory dump would be to manually trigger a dump using one of the many available tools during the exact time of issue. But there are times where it will not be feasible for us to manually trigger a Memory dump at the issue time. For example, the issue might happen during night time where no one will be around to capture the data. For such kind of Scenarios Automated way of capturing Data is always good. In this article I will walk you through one of such automated ways.
Steps for capturing High CPU Automated Dumps Using Perfview Command
Scenario 1: If you have only one w3wp.exe process running on the box.
Then Use the below command:
Perfview /NoGui collect "/StopOnPerfCounter=Process:% Processor Time:w3wp>25" -ThreadTime -CircularMB:1000 -CollectMultiple:5 –accepteula
Here 25 is the threshold value which show the CPU consumption by w3wp in %.And also this value can vary.
Example : If you're seeing 80% to 90% CPU utilization by w3wp.exe then this threshold value would be 80.
Scenario 2: If we running across multiple w3wp.exe process running on the box.
Then the command will be:
Perfview /NoGui collect "/StopOnPerfCounter=Process:% Processor Time:w3wp# >25" -ThreadTime -CircularMB:1000 -CollectMultiple:5 –accepteula
So here we are dealing with w3wp# . What is # here? how to get it, let's see this is below steps.
1. Open the Task Manager look for the wp3wp.exe which is consuming high CPU.

2. Process ID : 8208 (w3wp)
3. Start the Perfmon.
4. Start >> Run >>CMD >>Perfmon then Enter.
5. It will open the below window.
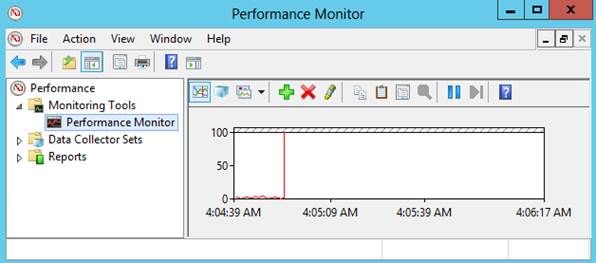
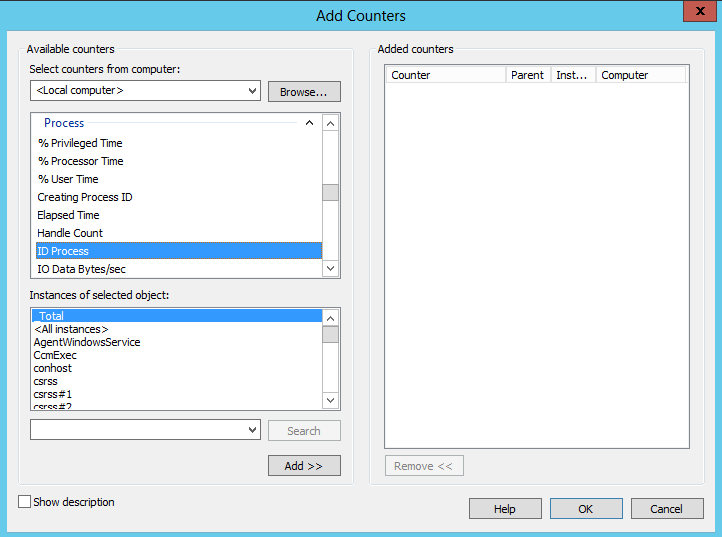
6. Choose Process from the print queue. Under that select ID Process.
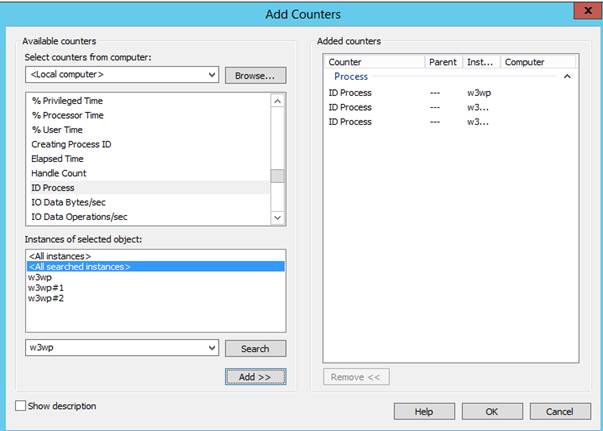
7. Under that select all the instance and search for w3wp in the text box. So you will be getting below window. Now at last click on ADD and then click ok.

8. On the below screen, look for the affected wp3wp with same process id. So in this case the wp3wp would be w3wp#2.
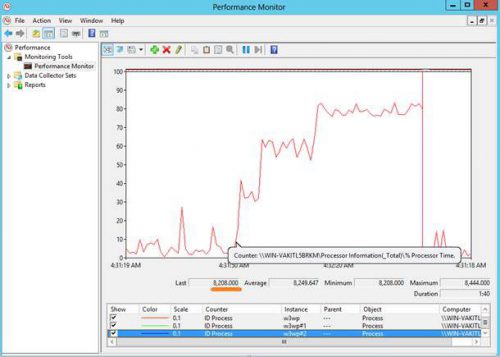
So here the w3wp# value would be w3wp#2. And now our command would be like this.
Perfview /NoGui collect "/StopOnPerfCounter=Process:% Processor Time:w3wp#2>75" -ThreadTime -CircularMB:1000 -CollectMultiple:5 –accepteula