Managing Breakpoints in Visual Studio 2010 using Breakpoint Labels
One of the new features that we've added to the Visual Studio 2010 debugger is the ability to manage breakpoints more effectively. You might say that the existing Breakpoints window is a fine tool for being able to manage your breakpoints. After all, you can create, modify and delete breakpoints using the Breakpoints window which is absolutely true.
However, what the existing Breakpoints window doesn't provide is the ability to group or filter breakpoints. This can be especially useful as you work on larger projects.
What is a Breakpoint Label anyway?
A Breakpoint Label is really just a string that you use to tag a breakpoint . Once you have labeled a breakpoint, you can do a number of operations on a breakpoint or group of breakpoints using that label. Let's look at a scenario that shows how to use breakpoint labels.
Scenario: Grouping related breakpoints together
The ability to bunch several breakpoints into a single group can be very useful when it comes to managing breakpoints. You can use whatever string you want to group breakpoints together . Here are a few ideas for breakpoint group names:
- Application layer, e.g. UI, Business Logic, Data
- Visual Studio project name, e.g. ChartVisuals
- Feature name, e.g. Widget
- Namespace and class name, e.g. ChartManager
- Data structure, e.g. Waveform
- Bug ID, e.g. BUG_704906
- etc.
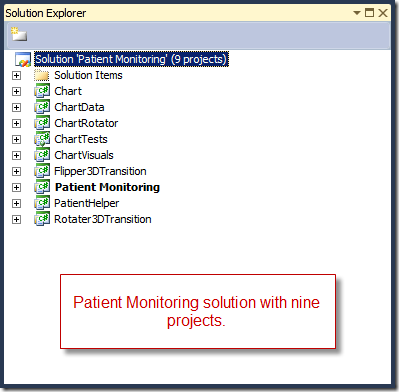
In the following example, I’m using the WPF Patient Monitoring application which has the following project structure.
For this scenario, I'm debugging a set of functions having to do with the Waveform data structure. I've set a breakpoint on all the functions that manipulate the Waveform data structure, so shown below. However, just by looking at the Breakpoints window, it's almost impossible to tell that these three breakpoints are related, other than the fact that they all share the same file name (PatientVitals.cs).

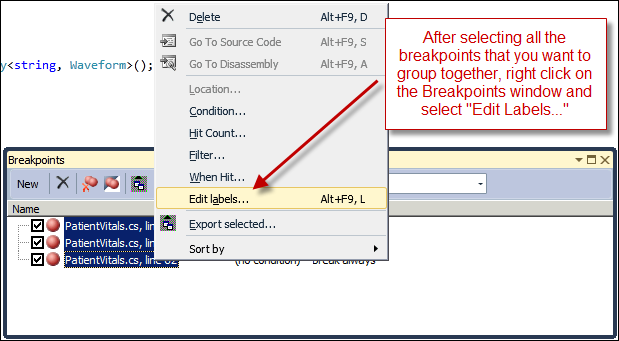
Using a breakpoint label, I can now tag all three breakpoints so that I can see their relationship. In order to do that, select all the breakpoints that you want to group and then right-click on the Breakpoints window. See the following screenshot.

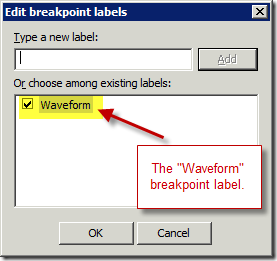
On the Edit Breakpoint Labels dialog, enter the string that you want to group the breakpoints by. In this example, I'm going to use "Waveform" since that is the data structure that these breakpoints are related to.
After creating the "Waveform" label, all the selected breakpoints now have the Waveform label.

If you now add more breakpoints, you can label these differently than the Waveform breakpoints. Hence, it's easy to see which breakpoints are related to the Waveform data structure and which ones are for debugging the Item Collection APIs, as shown below.

What can you do with these groupings you ask? You can perform various operations on one set of breakpoints without impacting other breakpoints. e.g. I can select the breakpoints related to the Waveform data structure and export them. To learn more about exporting/importing breakpoints, see my previous blog.
Breakpoint Labels are already available in Visual Studio 2010 Beta 1 and are pretty much language agnostic which means they can be used for C/C++/CLI, C#, VB, JScript, etc. If you have any feedback or suggestions, please feel free to provide your feedback on this blog. For example, can you think of other scenarios where breakpoint labels might come in handy?
Habib Heydarian.
Comments
Anonymous
July 20, 2009
Is this available for unmanaged C++?Anonymous
July 20, 2009
Yes. This feature is available for managed (C++/CLI) and unmanaged (C/C++).

