Tip o' the Week 329 – Fuzzy Duck? Yes, he does
Be honest. Do you know how to use the VLOOKUP function in Excel? It has its roots in @LOOKUP from VisiCalc, which goes back well over 30 years – see here for a demo (and, wipe a tear, you missed “VLOOKUP WEEK 2012”). It’s one of the more useful functions, where you can use tables of text to cross reference one another – leading some to create spreadsheets to manipulate data that might be achieved elsewhere by a database join or an IF…THEN…ELSE statement. VLOOKUP (and her friends, HLOOKUP, LOOKUP and the other reference functions) is all very well if you have nicely constructed and controlled data – but what if you have messy text that has been entered by end users? How do you go about normalising that without boring brute force (ie ploughing through it all yourself) ? Imagine, if you will, that you have a list of a few hundred company names exported from your CRM system – let’s call them “Partners”. What if you also had many thousands of unique names from people who’ve registered at a conference? (Let’s call that “Partner Conference”) . Wouldn’t it be nice to run a report which shows the team that works with each partner, who has registered and where they’re from? If the registration tool allowed anyone to enter free text fields for the name of their company, you’ll get any number of variations, mis-spellings etc – maybe even the odd deliberate spanner. (On the McX Face front, once again, El Reg excelled itself with this headline, though has a way to go to top the best so far… or the subheading of this one, which reads like a line from a DC Thomson cartoon). These names won’t allow VLOOKUPs as they’ll show up as all different, and therefore cross-referencing one source with the other will be difficult. So even telling Jane Smith, who manages the ACME Inc account, that these 10 people are attending the conference, is going to be hard if every one of them registered with a variation of A.C.M.E, ACME Inc, Ac-me Ltd and so on.
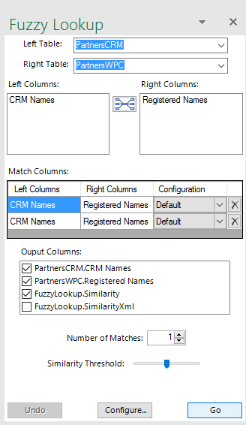
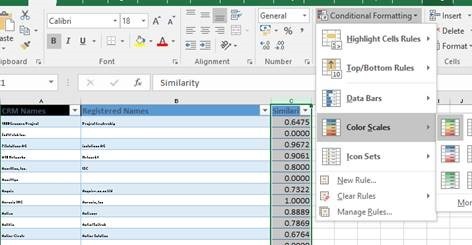
The Fuzzy Lookup tool will add extra columns to the source table; showing the text that it thinks is the nearest match, and a score of “similarity”. The technology comes from Microsoft Research, and uses the Jaccard Similarity method of comparing sample data sets. One technique for comparing a couple of different columns is to set conditional formatting on the Similarity column and choose colour scales for easy identification of the ones likely to be correct; or simply put a filter on that column and hide rows below an arbitrary low bar (like 0.6). Then spin down the two columns to the left and check to see if they tally up, given the human eye for spotting similarity, spelling mistakes etc. You could even add a Y/N column to the right so you can manually affirm which is right and which is not, then filter on that to confirm.
Fuzzy Duck? Ducky Fuzz! Does he? (look it up on Wikipedia – NSFW, obvs). |


