Using Support Debugging Tool Non-Logging Triggers

This is the fourth in a series of articles that are designed to help you understand how the Support Debugging Tool works and how you can leverage its different features. In the past, I have described features without explaining how these features can be used and what the differences between different modes is. With this series I hope to remedy that situation.
In the previous articles, we discussed the different Logging Modes of the Support Debugging Tool and how to control Manual Logging Mode and Automatic Debugger Mode. In this article we will discuss ways to use Automatic Debugger Mode Non-Logging Triggers. If you missed the other articles, please have a read: Understanding Support Debugging Tool Logging Modes, Controlling Support Debugging Tool Manual Logging Mode and Controlling Support Debugging Tool Automatic Debugger Mode.
Non-Logging Triggers
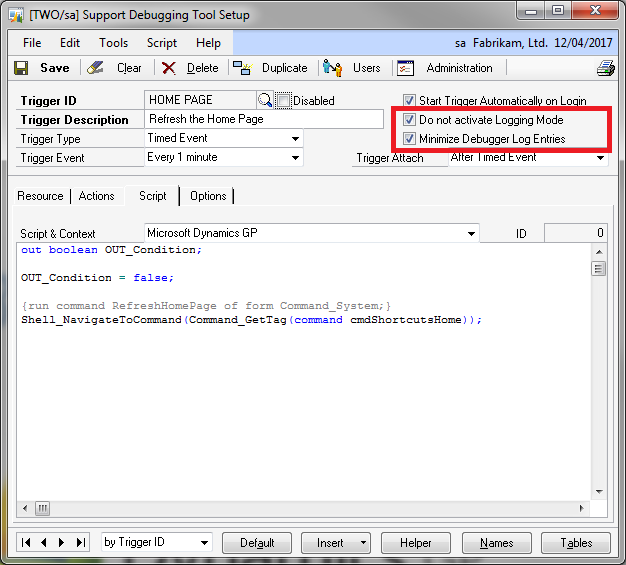
As discussed in the previous articles, Automatic Debugger Mode combines the logging capabilities of Manual Logging Mode with Dexterity triggers. These triggers are created on-the-fly and are used to watch look for error conditions when the specified event occurs. Once the Support Debugging Tool was being used, it was realised that there might be times that it would be useful to have the trigger functionality without the logging capabilities. So the option "Do not activate Logging Mode" was added to the Setup Automatic Debugger Mode window. This option allows scripts to be executed when specific events occur without stopping and starting the logging functionality.
The "Minimize Debugger Log Entries" option was added later so that Non-Logging triggers would not fill up the Debugger_<User>_<Company>.log files with lines just explaining their successful operation. If you have an issue and need to troubleshoot a Non-Logging Trigger, you should uncheck this option.

Non-Logging Trigger example: Refresh the Home Page every minute.
Note: The command shown in this script is undocumented and unsupported.
Troubleshooting with Non-Logging Triggers
We have already demonstrated the use of Non-Logging Triggers with the Automated Start and Stop methods to control Manual Logging Mode and Automatic Debugger Mode. These examples used the MBS_Logging_Start & MBS_Logging_Stop and MBS_Trigger_Start & MBS_Trigger_Stop helper functions.
We can also use Non-Logging triggers to capture information that might be helpful in troubleshooting issues, such as writing the value of window fields to the log with the MBS_Auto_Log helper function, writing the contents of a table buffer out as an XML file using the built-in actions on the trigger, or even popping up desktop alerts when certain scripts are run to help watch the flow of code in a system.
These methods can be used to "see" data that is not normally visible on the interface or in a SQL table. This data can be internal flags that show the status of data, or the values of fields in a temporary table, or even the values stored in a form's table buffer instead of in window fields.
Fixing issues with Non-Logging Triggers
There have been situations where an issue with the Microsoft Dynamics GP code has been found and logged as problem report, and then the problem report has been scheduled to be fixed in the next hotfix or service pack. While this means the issue will be resolved once the fix is released, it does not solve the issue now. Some issues can be fixed using Dexterity triggers to make the code behave in the desired fashion. Automatic Debugger Mode Non-Logging Triggers can be used to resolve issues while we wait for the official fix to be released. The code can be deployed quickly and simply and then removed or disabled once the hotfix or service pack is deployed.
Whether issues can be fixed this way depends on each individual situation. It is not always possible to get the trigger in the correct location and it is not always possible to get to the required data or information. One limitation of the Support Debugging Tool and its triggers is that while it can trigger on form level and global functions and procedures, it cannot capture the parameters of those functions and procedures. This is a limitation of on-the-fly triggers because to access the parameters the trigger handling script must be compiled with a matching list of parameters in its code, something that is not possible when you don't know in advance which functions or procedures the triggers will be registered against.
Customising with Non-Logging Triggers
In the same way that some issues can be fixed with the use of Non-Logging Triggers, some customisations can be developed using Non-Logging Triggers. While the Support Debugging Tool provides some customisation capabilities, it is not a replacement for tools such as Dexterity, Visual Basic for Applications (VBA) and Visual Studio Tools for Microsoft Dynamics GP (VSTMDGP).
Below is a list of some of the Pros and Cons of using Non-Logging Triggers for customisations:
Pros:
- Assuming the Support Debugging Tool is installed on all workstations and using a shared location for its data (Recommended Configuration), deployment of customisations does not require additional code applied at every workstation. Just updating the one central location affects all workstations.
- Triggers can be limited to only work for specific users and/or companies.
- Triggers can be applied on all events supported by Dexterity triggers, plus some additional options such as timed events.
- The Support Debugging Tool can work across multiple Dexterity dictionaries with the assistance of cross dictionary helper functions.
- The Support Debugging Tool can embed calls to Dexterity (Runtime Execute) and SQL (SQL Execute) scripts.
- The Support Debugging Tool can pass "parameters" between Dexterity scripts using helper functions. The parameter data is stored temporarily in the VBA DUOS (Dynamic User Object Store) table, also know as the SY_User_Object_Store (SY90000) table.
- The Support Debugging Tool can access table or database events not visible to VBA as well as table buffer contents.
Cons:
- Function and Procedure triggers cannot access the parameter values. Please see Using the Support Debugging Tool with Function and Procedure parameters for a method of capturing parameters using Dexterity.
- The Support Debugging Tool cannot create new fields, windows or forms. It can only work with existing user interface resources.
- The Support Debugging Tool cannot create or modify tables. It can only work with existing table resources.
- The Support Debugging Tool cannot create or modify reports. The only integration it has with reports is via User Defined functions and Runtime Execute scripts. See Using the Support Debugging Tool to assist with Report issues for more information.
- The Support Debugging Tool scripts cannot "see" field resources added by the Modifier as it only works with resources which exist on the original window.
- The Support Debugging Tool does not protect intellectual property as the code is visible. It should not be used as a commercial development tool.
Within these limitations, it is possible to some simple customisations that might be difficult or at least much more work with the other tools.
Starting and Stopping Non-Logging Triggers
Automatic start at login
Non-Logging Triggers can be started Automatically using the "Start Trigger Automatically on Login" option when setting up the trigger. Once this option is enabled, you can optionally set up the users and/or companies for which the trigger will start. Once started the trigger will stay active until it is manually stopped, the user changes company and/or user, or the application is exited.
Manually Starting
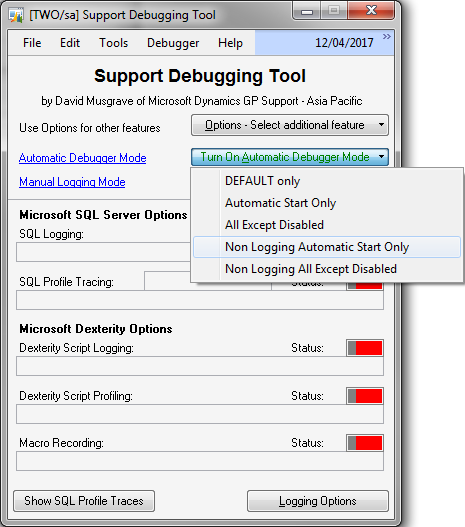
Non-Logging Triggers can be manually started from the main Support Debugging Tool window (available from the application level or window level Tools menus, or by pressing Ctrl-D). Just select the Turn On Automatic Debugger Mode button and choose Non Logging Automatic Start Only or Non Logging All Except Disabled.

Main Support Debugging Tool window
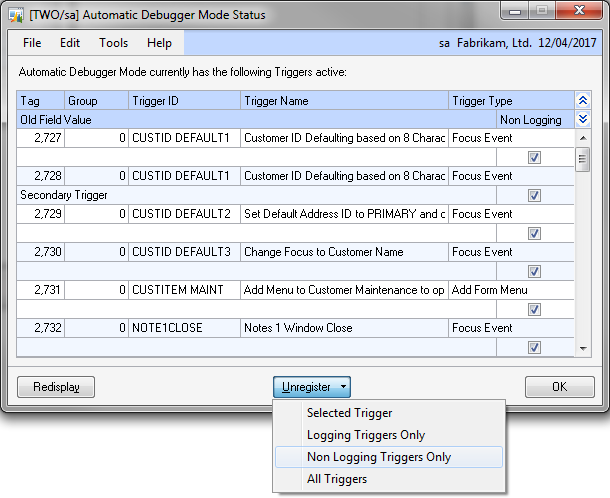
To see what triggers are currently active, you can open the Automatic Debugger Mode Status window from the Options menu or by clicking on the Automatic Debugger Mode hyperlink to the left of the Turn On Automatic Debugger Mode button.
Manually Stopping
To stop Non-Logging Triggers, open the Automatic Debugger Mode Status window and use the Unregister button to unregister a single trigger, all Non-Logging Triggers or All Triggers.

Automatic Debugger Mode Status window
Note: All triggers must be unregistered before the Setup Automatic Debugger Mode window can be opened.
Hope you find this information on Support Debugging Tool Non-Logging Triggers useful.
David
Comments
Anonymous
July 14, 2012
Very useful...Anonymous
July 18, 2012
Posting by Jivtesh Singh at About Dynamics, Development and Life www.jivtesh.com/.../making-dynamics-gp-remember-position-of.htmlAnonymous
July 18, 2012
Posting from Mark Polino at DynamicAccounting.net msdynamicsgp.blogspot.com.au/.../using-support-debugging-tool-non.html