Special Command—Execute Commands from a Customized User Interface with .cmdtree
A few weeks ago I received an e-mail from Brad Wilson, a Support Escalation Engineer from the OCS (Office Communications Server) team. Brad asked me about the .cmdtree command and I told him I’ve never configured it before. A few days ago he sent me another e-mail saying he figured out how to use this command. I decided to try it and… wow! Pretty cool!
So, here is the thing, you can use this technique to create a window that has your most used commands or those that you never remember how to use. J
Brad thanks for sharing it! Readers, again I repeat myself here: I bet you’re going to like it!
Here are the steps:
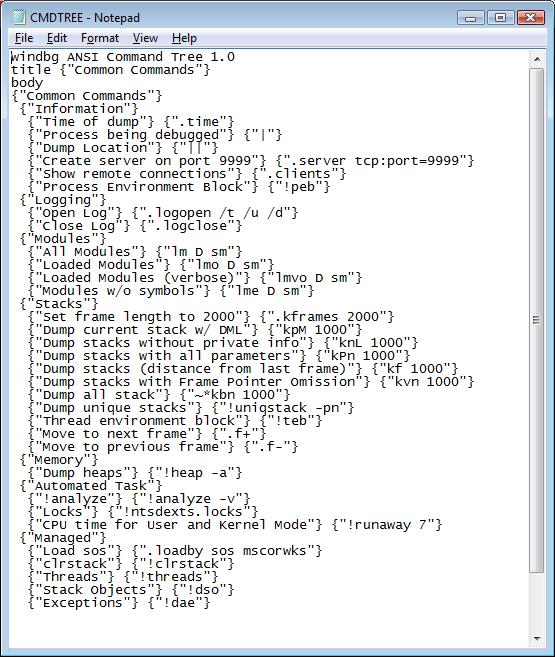
a) Create a text file, CMDTREE.TXT, with your commands, using the example below as a template. You can modify sections between {} the way you want:
windbg ANSI Command Tree 1.0
title {"Common Commands"}
body
{"Common Commands"}
{"Information"}
{"Time of dump"} {".time"}
{"Process being debugged"} {"|"}
{"Dump Location"} {"||"}
{"Create server on port 9999"} {".server tcp:port=9999"}
{"Show remote connections"} {".clients"}
{"Process Environment Block"} {"!peb"}
{"Logging"}
{"Open Log"} {".logopen /t /u /d"}
{"Close Log"} {".logclose"}
{"Modules"}
{"All Modules"} {"lm D sm"}
{"Loaded Modules"} {"lmo D sm"}
{"Loaded Modules (verbose)"} {"lmvo D sm"}
{"Modules w/o symbols"} {"lme D sm"}
{"Stacks"}
{"Set frame length to 2000"} {".kframes 2000"}
{"Dump current stack w/ DML"} {"kpM 1000"}
{"Dump stacks without private info"} {"knL 1000"}
{"Dump stacks with all parameters"} {"kPn 1000"}
{"Dump stacks (distance from last frame)"} {"kf 1000"}
{"Dump stacks with Frame Pointer Omission"} {"kvn 1000"}
{"Dump all stack"} {"~*kbn 1000"}
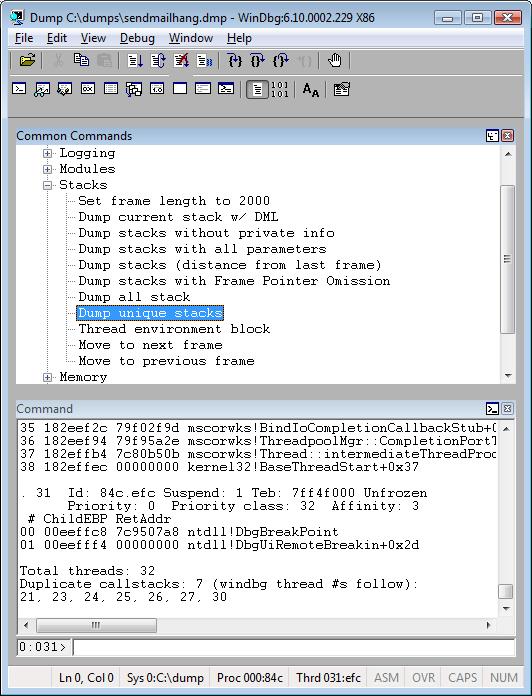
{"Dump unique stacks"} {"!uniqstack -pn"}
{"Thread environment block"} {"!teb"}
{"Move to next frame"} {".f+"}
{"Move to previous frame"} {".f-"}
{"Memory"}
{"Dump heaps"} {"!heap -a"}
{"Automated Task"}
{"!analyze"} {"!analyze -v"}
{"Locks"} {"!ntsdexts.locks"}
{"CPU time for User and Kernel Mode"} {"!runaway 7"}
{"Managed"}
{"Load sos"} {".loadby sos mscorwks"}
{"clrstack"} {"!clrstack"}
{"Threads"} {"!threads"}
{"Stack Objects"} {"!dso"}
{"Exceptions"} {"!dae"}

b) Save the text file in the same folder your WinDbg is installed. Mine is in c:\debuggers.
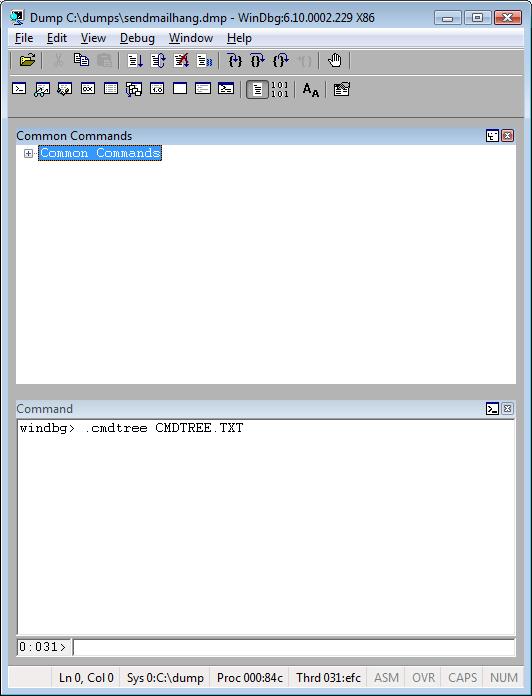
c) Open a dump file, load the symbols, then use this command:
.cmdtree CMDTREE.TXT

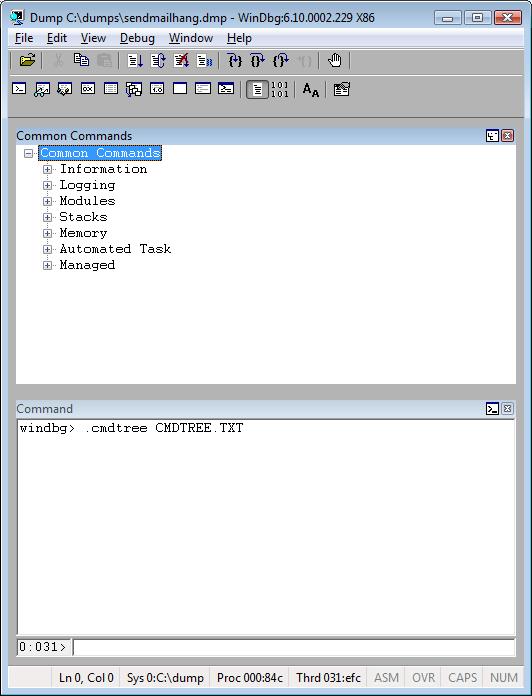
d) The command above will create a new WinDbg window that has your commands. You can double click one item from the tree view window to execute the command.


See you on my next article.
Comments
Anonymous
September 16, 2008
PingBack from http://www.easycoded.com/special-command%e2%80%94execute-commands-from-a-customized-user-interface-with-cmdtree/Anonymous
September 17, 2008
Very powerful indeed! And not documented in DEBUGGER.CHM!Anonymous
September 17, 2008
Roberto Farah and Brad Wilson figured out the undocumented, but extremely cool .cmdtree WinDBG command.Anonymous
September 17, 2008
今天找到的文章非常好,Anonymous
September 17, 2008
消息Anonymous
September 18, 2008
It's very cool, both function and ideal. Thanks for your sharing.Anonymous
September 20, 2008
Je ne suis qu’un utilisateur assez occasionnel de WinDbg mais il faut que je retienne l’existence deAnonymous
September 25, 2008
Great post. No more windbg mind blanks ever ever again :DAnonymous
September 30, 2008
There is an undocumented feature in WinDbg that may be useful for remembering WinDbg commands and essentially