VS2010: Profiling In Progress (PIP)
With Visual Studio 2010 we want to make it clearer when you are profiling your application within the Visual Studio IDE. To accomplish this we added a new control which we call ‘Profiling In Progress’ or PIP, which we show when you launch the profiler or attach the profiler to a running application.
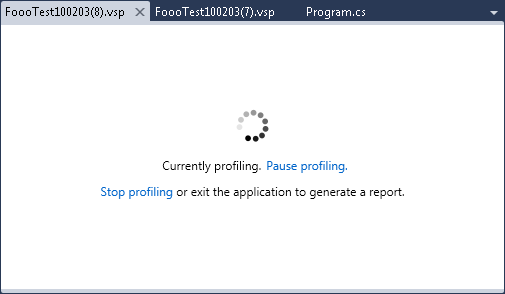
Our goal was to show something simple and lightweight while profiling and to make a few simple operations possible. PIP in VS2010 is shown below:
 Currently profiling. Pause profiling. Stop profiling or exit the application to generate a report.
The progress/spin control indicates that the UI is responding and there are two links:
- Pause profiling, which changes to ‘Resume profiling’ when clicked. This has the same effect as clicking on the ‘Pause profiling’ button in the Performance Explorer.
- Stop profiling, which kills the application and finishes profiling.
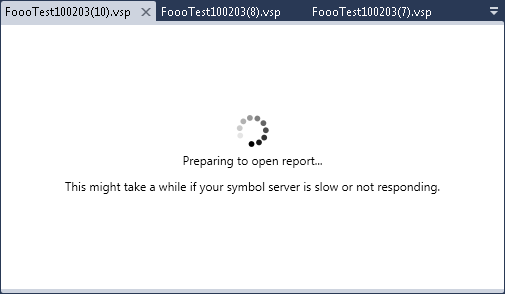
After profiling completes, PIP changes to show that we are about to open the report.
 Preparing to open report… This might take a while if your symbol server is slow or not responding.