Parallel Virtual File Systems on Microsoft Azure – Part 5: Monitoring and conclusion
Written by Kanchan Mehrotra, Tony Wu, and Rakesh Patil from AzureCAT. Reviewed by Solliance. Edited by Nanette Ray.
This article is also available as an eBook:
Find the previously published parts of this series here:
Monitoring
To validate the assumptions made when designing a PVFS, monitoring is essential. Our informal performance testing included only a basic level of monitoring, but we recommend monitoring both the cluster and the nodes to see if the system needs to be tuned or sized to suit the demand. For example, to monitor I/O performance, you can use the tools included with the operating system, such as iostat, shown in Figure 1.

Figure 1. Monitoring I/O performance using the iostat command
Install and run Ganglia
For cluster-level management, Ganglia offers scalable, distributed monitoring for HPC systems, such as clusters and grids. Ganglia is based on a hierarchical design targeted at federations of clusters. It makes use of widely used technologies, such as XML for data representation, XDR for compact, portable data transport, and RRDtool for data storage and visualization. Figure 2 shows an aggregated view from Ganglia, displaying compute clients and other components.
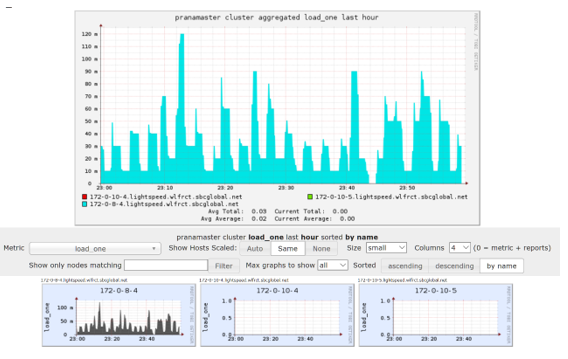
Figure 2. Ganglia aggregated view
Ganglia includes three main components:
- gmond is a daemon that must be deployed on each node you want to monitor. It gathers monitoring statistics and sends and receives the statistics within the same multicast or unicast channel.
When acting as sender (mute=no), gmond collects basic metrics, such as system load (load_one) and CPU utilization. It can also send user-defined metrics through the addition of C/Python modules.
When acting as receiver (deaf=no), gmond aggregates all metrics sent to it from other hosts, and it keeps an in-memory cache of all metrics. - gmetad is a daemon that polls gmonds periodically and stores the metrics in a storage engine, such as RRD. It can poll multiple clusters and aggregate the metrics. The web interface generates its display from gmetad statistics.
- ganglia-web is the front-end display. It must be deployed on the same node as gmetad as it needs access to the RRD files.
To install Ganglia for monitoring the status of the grids or cluster:
Go to GitHub and install Ganglia (see HPC-Filesystems/Lustre/scripts/).
Download the script to the nodes where you want to set up Ganglia, and pass the following parameter to the script:
<master/gmetad node>For example, Server00oss0 master 8649.
Add an inbound rule for port 80.
In a browser, open Ganglia at https://<IP of monitored node>/Ganglia.
To monitor the cluster, log on to Ganglia. The following screen appears.

In the Choose a Source box, notice that the cluster appears.
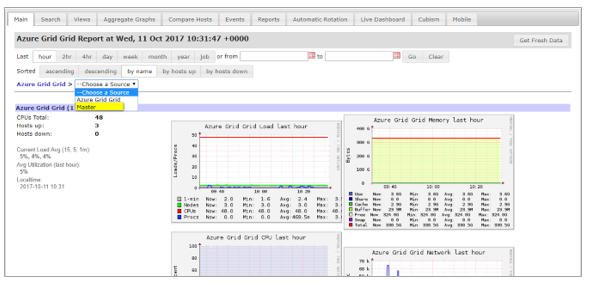
Select a cluster, then in the Choose a Node box, select the node you want to view.
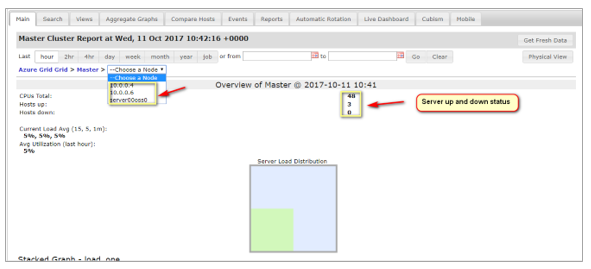
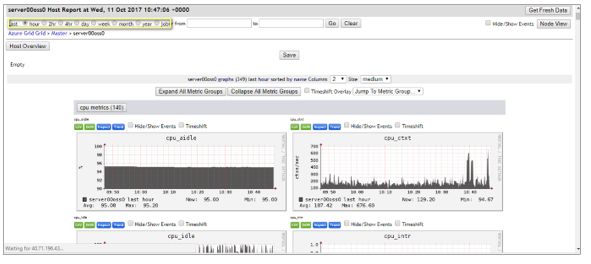
After you select a node, its status is displayed as a function of time. Note that Ganglia can generate XML and CSV files from the status information.
Use BeeGFS monitoring tools
BeeGFS includes lightweight monitoring that provides client statistics from the perspective of the metadata operations as well as throughput and storage nodes statistics. As Figure 3 and Figure 4 show, you can monitor individual nodes, see an aggregated view, and get real-time feedback in one-second intervals.
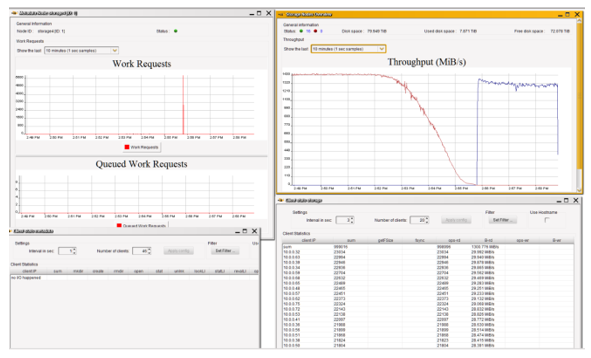
Figure 3. BeeGFS monitoring views 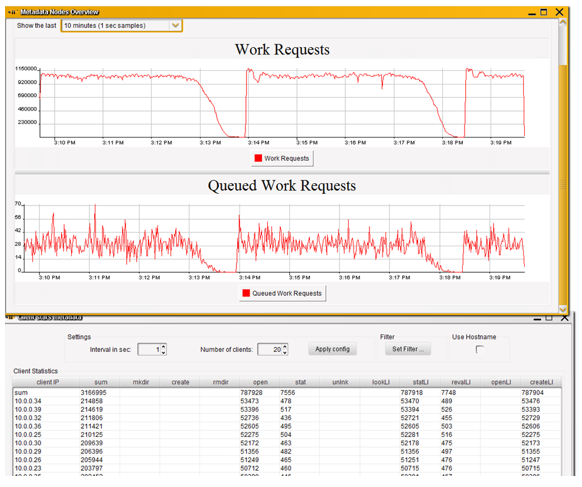
Figure 4. Monitoring work requests in BeeGFS
Conclusion
The goal of our performance testing was to see how scalable Lustre, GlusterFS, and BeeGFS are based on a default configuration. Use our results as a baseline and guide for sizing the servers and storage configuration you need to meet your I/O performance requirements. Performance tuning is critical.
Our test results were not always uniform—we spent more time performance-tuning BeeGFS than Lustre or GlusterFS. When we tested our deployments, we got good throughput for both Lustre and GlusterFS, and performance scaled as expected as we added storage nodes.
Our performance results were based on a raw configuration of the file systems obtained in a lab with an emphasis on scalability. Many variables affect performance, from platform issues to network drivers. Network performance, for instance, obviously affects a networked file system.
We hope to do more comprehensive testing in the future to investigate these results. In the meantime, we can’t emphasize repeatability enough in any deployment. Use Azure Resource Manager templates, run scripts, and do what you can to automate the execution of your test environment on Azure. Repeatability is the cornerstone of solid benchmarking.
Learn more
For more information, see the following resources:
Thank you for reading!
This article is also available as an eBook:
Azure CAT Guidance
"Hands-on solutions, with our heads in the Cloud!"