Hyper-V Client Tracing – Tracing the User Interface (“UI”)
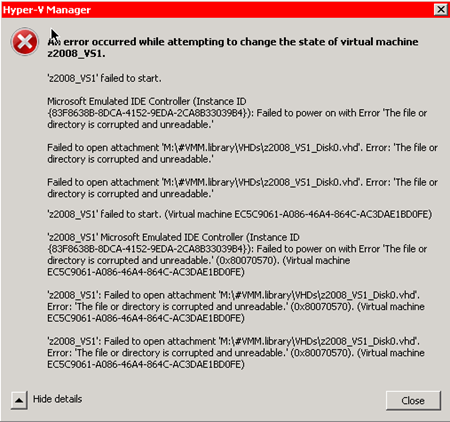
The purpose of this article is to explain a troubleshooting methodology with Hyper-V that goes a little deeper than the Event Logs. I’m creating a simple problem, starting a Virtual Machine with a corrupt .vhd file, to show how to proceed. I’m simply starting my VM, z2008_VS1 from the Hyper-V Manager. The following error pops up (showing “Details”) here.
The first place we should check is the Event Viewer logs under Microsoft, Windows, Hyper-V. Note the many areas logged.
In the Admin folder, this error appears.
In text format the error is:
Log Name: Microsoft-Windows-Hyper-V-Worker-Admin
Source: Microsoft-Windows-Hyper-V-Worker
Date: 4/5/2010 5:47:03 PM
Event ID: 12010
Task Category: None
Level: Error
Keywords:
User: NETWORK SERVICE
Computer: z2008.northamerica.corp.microsoft.com
Description:
'z2008_VS1' Microsoft Emulated IDE Controller (Instance ID {83F8638B-8DCA-4152-9EDA-2CA8B33039B4}): Failed to power on with Error 'The file or directory is corrupted and unreadable.' (0x80070570). (Virtual machine EC5C9061-A086-46A4-864C-AC3DAE1BD0FE)
In order to enable tracing open a command prompt and navigate to the directory: "%appdata%\Microsoft\Windows\Hyper-V\Client\1.0\" In other words, at a command prompt type "CD %appdata%\Microsoft\Windows\Hyper-V\Client\1.0\" (without the quotes) and this will open the correct directory. You can also use Start, Run, and enter "%appdata%\Microsoft\Windows\Hyper-V\Client\1.0\" (without the quotes) to open the directory in Explorer. There, create a file called "VMClientTrace.config" (from now on, assume without the quotes...). Use notepad or an xml editor to paste the following.
<?xml version="1.0" encoding="utf-8"?>
<configuration>
<Microsoft.Virtualization.Client.TraceConfigurationOptions>
<setting name="TraceTagFormat" type="System.Int32">
<value>3</value>
</setting>
<setting name="BrowserTraceLevel" type="System.Int32">
<value>6</value>
</setting>
<setting name="VMConnectTraceLevel" type="System.Int32">
<value>6</value>
</setting>
<setting name="VHDInspectTraceLevel" type="System.Int32">
<value>6</value>
</setting>
</Microsoft.Virtualization.Client.TraceConfigurationOptions>
</configuration>
You can adjust the trace levels (more on this later), but for most purposes the values used above should be just right. You’ll need to stop and restart the UI (close Hyper-V Manager and reopen it). And then re-produce your issue.
Note that the UI must be restarted, we do not support dynamically turning on tracing. The tracing files are written to %temp%. Again you can get to the correct location by "CD %TEMP%" at a command prompt or running /start /run "%TEMP%" The file will be named VMBrowser_Trace_20100404084318.log - the numbers in the filename will change to reflect the timestamp of when the UI was started. You can read the log in notepad or Word, the latter I fund useful to use large page sizes with very small type. If you search the log for "ERROR" you'll come across something like the following.
2010-04-04 08:43:32.606, ERROR [7] VMBrowser ServerNodeViewControl:WaitForTaskCompletion() 'z2008_VS1' failed to start.
Microsoft Emulated IDE Controller (Instance ID {83F8638B-8DCA-4152-9EDA-2CA8B33039B4}): Failed to power on with Error 'The file or directory is corrupted and unreadable.'
Failed to open attachment 'M:\#VMM.library\VHDs\z2008_VS1_Disk0.vhd'. Error: 'The file or directory is corrupted and unreadable.'
Failed to open attachment 'M:\#VMM.library\VHDs\z2008_VS1_Disk0.vhd'. Error: 'The file or directory is corrupted and unreadable.'
at Microsoft.Virtualization.Client.Management.ThrowHelper.ThrowVirtualizationOperationFailedException(String errorMsg, String errorDescriptionMsg, VirtualizationOperation operation, Int64 errorCode, ErrorCodeMapper mapper, Exception innerException)
at Microsoft.Virtualization.Client.Management.View.EndMethodReturnInternal(IVMTask task, VirtualizationOperation operation, Boolean affectedElementExpected)
at Microsoft.Virtualization.Client.Management.VMComputerSystemView.EndSetState(IVMTask setStateTask)
at Microsoft.Virtualization.Client.VMBrowser.ServerNodeViewControl.WaitForTaskCompletion(Object taskWaitObject)
If you’re saying to yourself that looks a lot like what we’ve already seen, keep in mind this is just to demonstrate how to enable UI Tracing. In a more serious situation (that couldn’t be resolved from the EV logs entries alone), a Microsoft Support Professional would be able to more definitively determine the issue. Microsoft may also provide you with a custom VMClientTrace.config file for the specific issue at hand.
Configuring Tracing Levels
The tracing configuration file provides options to control which traces are gathered and how they are formatted. The first tag is TraceTagFormat. A value of 1 instructs the tracing system to tag each message with a time stamp. Other configuration file tags specify what tracing level to use for each UI app. UI tracing supports six different levels of tracing. Tracing levels and their corresponding tag values are shown in the following table.
Each higher level includes all of the tracing from lower levels and additional information. For example, setting the value to 5 includes all exceptions, WMI calls, user actions, and WMI events, as well as general information.
Tag Value |
Description |
0 |
None |
1 |
Exception (all caught exceptions will be traced) |
2 |
WMI call (information about each WMI call made by the UI) |
3 |
UserAction (each user action, such as the user is launching the New Virtual Machine Wizard) |
4 |
Events (Turning on/off or receiving WMI events from the server) |
5 |
Information (General information) |
6 |
Verbose |
Summary
This article is intended as a possible troubleshooting step, i.e. a “how to” as opposed to a specific solution.
In this case the vhd was intentionally corrupted by disconnecting storage while the virtual drive was being created. We’ve seen corruption for this and other reasons, including 3rd party encryption and anti-virus programs.
Author
Thomas E. Acker
Microsoft Corporation


