How to debug the tests failed on the virtual environment?
In this post, I will talk about how I normally debug the automated tests failure on a virtual lab environment.
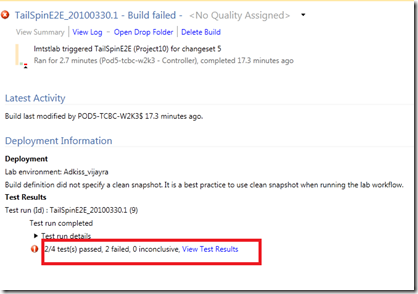
1. Most of our automated test cases are executed as part of the end-to-end workflow. So I first check the build summary to find out how many test passed/failed. In the example below, it is showing that out of 4 tests, 2 passed and 2 failed.
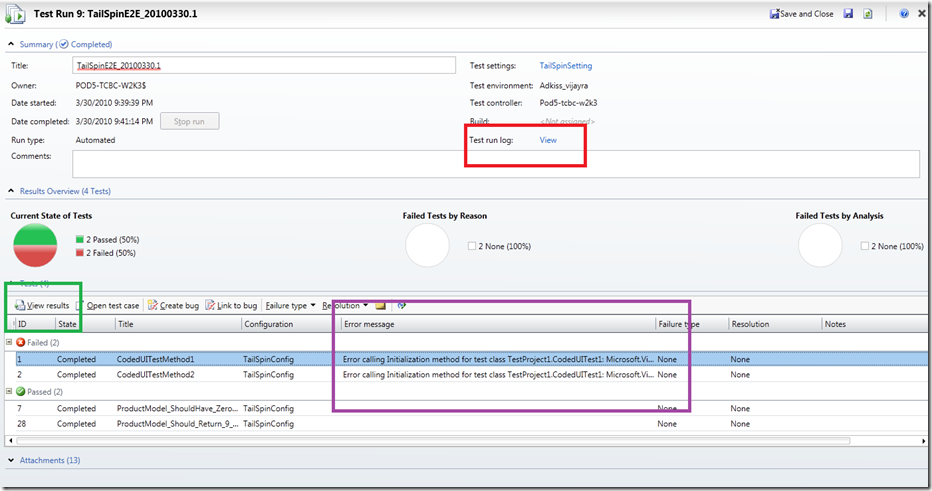
2. Then I will click on the “View Test Results” link shown above in the red box which will launch Microsoft Test Manager (MTM) showing the details of the test run and the test cases which failed and their failure message etc.
3. To understand what’s going on, I typically do the following: -
- Look at the “Test run logs” (the one in red box above) and see whether there is any run level warning/error in it.
- Then I look at the error message in the failed test case (the one in purple box above) to know the reason for the failure. Lot of times this error message is good enough to figure out the real cause of the failure.
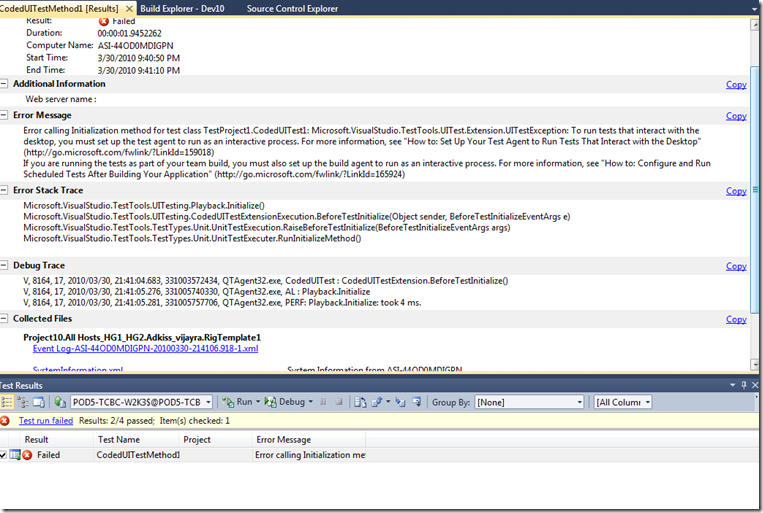
- If still the real cause is not clear, then I look at the result of the test case (the one in green box above). The result will contain an attachment named tmiResult.tr_ which contains the test logs, compete stack trace etc. Just click on this tmiResult attachment and it will open it in the Visual Studio showing all the logs, stack trace etc (as shown below).
4. If the test logs are not sufficient to find out the cause, I typically add more logs in the test case and re-run the test and follow the 3.3 step again. This way the logging of the test case also improves so that if the test fails next time, it is easier to debug.
5. To re-run the test case in the above step, normally I tend to queue the workflow again using the binaries from my local drop location. However there is a little variant here where instead of rerunning the workflow, it is possible to login to the machine and run the failed test manually. Once a test case gets executed on a virtual environment, the test/dependent binaries gets deployed in a temporary folder on the virtual machine. So it is possible to just replace the test binary containing better logs in that temporary folder and then manually run the test case using MSTest. To do that, following steps should be followed.
The temporary folder where the test/dependent binaries are stored on the lab machine is typically like %LocalAppData%\VSEQT\QTAgent\<Guid>\<LabSystemName>\Deployment. For example: – In case the agent is running under network service, the directory looks like C:\Windows\ServiceProfiles\NetworkService\AppData\Local\VSEQT\QTAgent\1095180f-805b-4c75-aa50-794f8145f8ee\RigTemplate1\Deployment.
Once the test binary is updated with with better logs and the temporary directory is not in use (i.e. when test run is complete), copy the updated test binary in the temporary folder.
Now open a command prompt and go to this directory and run the failed test using MSTest. The command to run the failed test looks something like this: -
C:\Windows\ServiceProfiles\NetworkService\AppData\Local\VSEQT\QTAgent\1095180f-805b-4c75-aa50-794f8145f8ee\RigTemplate1\Deployment> “C:\Program Files\Microsoft Visual Studio\Common7\Ide\MsTest.exe” /testcontainer:mytestproject.dll /test:mytestmethod
Note: – Ideally you should be logged in to the lab machine as the account under which the test agent was running so that the run parameters are exactly the same. But by default the agent is configured to run as “network service”, so you will not be able to login under that account. In that case you can run the test case under different account and ensure that it works fine. (If under different account test works fine, then the failure should be because of permission issues etc, in that case you can run the test case under network service using psexec tool.)
6. Additionally you can do remote debugging of your test case as well. You can copy the remote debugger monitor on the lab machine, start it and then connect to it using your visual studio, attaching to the agent execution process (QTAgent32.exe). Now you can put breakpoint on your test code and debug.
Comments
- Anonymous
January 02, 2013
Where have the files that used to be persisted in C:WindowsServiceProfilesNetworkServiceAppDataLocalVSEQTQTAgent gone with 2012 Test Manager? - Anonymous
January 02, 2013
@josephf The location remains the same. You should find this available on your remote test agent which is executing your run.Also do check if the location has been overridden. This location is configurable by using the "WorkingDirectory" in your QTAgentService.exe.config.


