Analyze app usage in Developer Portal
Developer Portal provides a comprehensive suite of tools to help you analyze and understand your app’s performance and user engagement. By using these analytics, you can gain valuable insights into how users interact with your app, identify areas for improvement, and make data-driven decisions to enhance the overall user experience.
Whether you’re tracking active users, retention rates, or usage patterns across different platforms, Developer Portal helps you with the information you need to optimize your app and ensure its success. Custom apps built for your org (LOB apps) can access app usage data only for Teams. However, for third-party apps you can explore new Microsoft 365 dimensions, such as host product and capabilities.
The app usage for a given day is reflected within 24 to 48 hours, and usage data for the new apps can take up to three to five days to reflect in the charts.
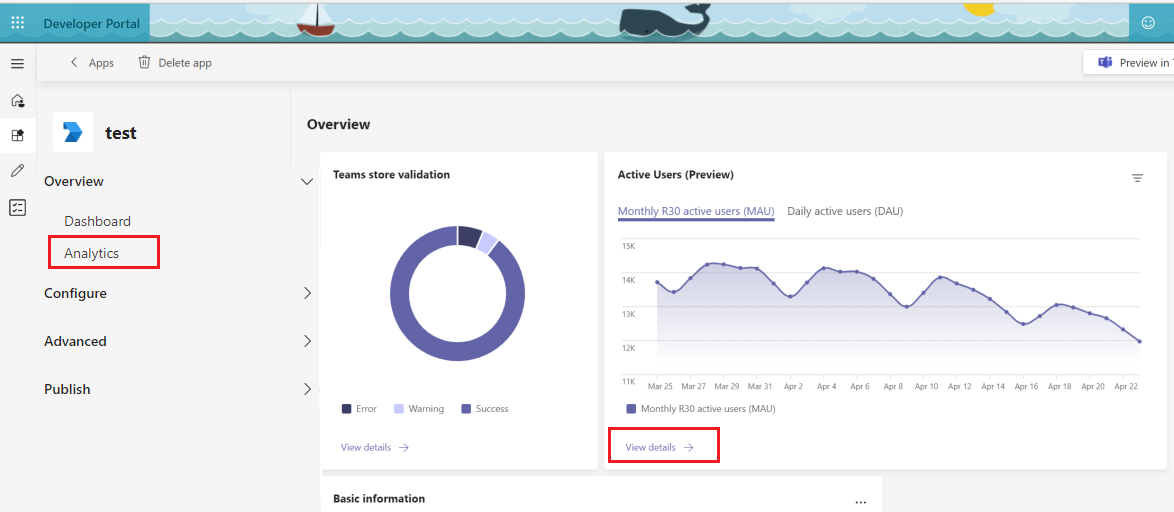
You can view your custom app's usage and other insights from the Analytics page. To access the page:
Go to Developer Portal.
Select Apps from the left pane.
Select the required app from the Apps page.
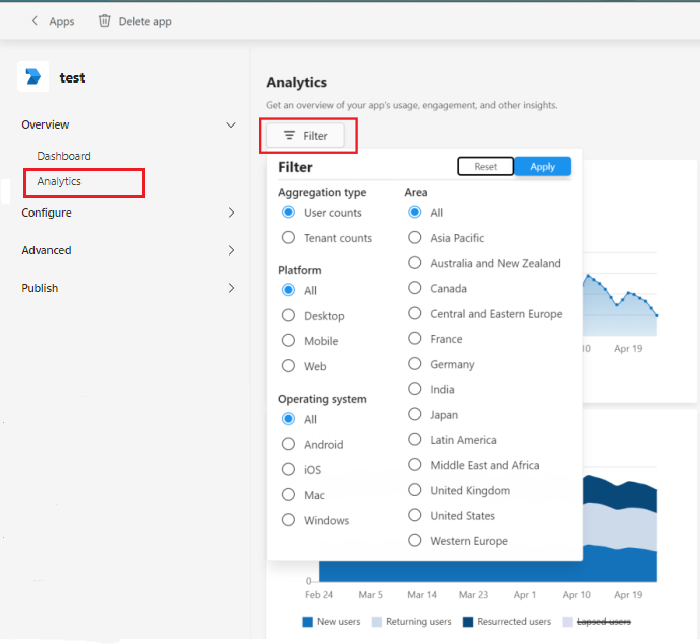
Select Analytics under the Overview section or select View details under the Active Users (Preview) card.

| Metric | Definition |
|---|---|
| Monthly R30 active users (MAU) | The default usage metric. It shows the count of unique active users who used your app within that rolling 30 days window in UTC. |
| Daily active users (DAU) | It shows you the count of unique active users who used your app in a given day in UTC. |
| Weekly R7 | It shows the count of unique active users who used your app within that rolling 7 days window in UTC. |
As you explore individual metrics on this page, you can use the Filter button to analyze your app's usage from the following filter options:
- Aggregation type: This filter allows you to group the metrics by a count of distinct users or a count of distinct tenants or customers.
- Platform
- Operating system
- Area
After you have selected your desired filters, you can explore the following individual widgets:
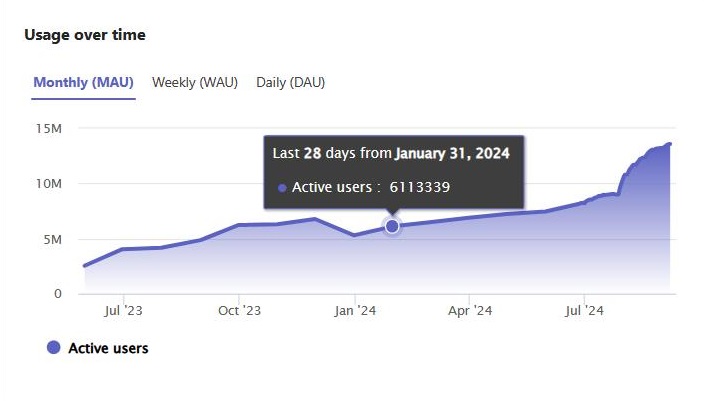
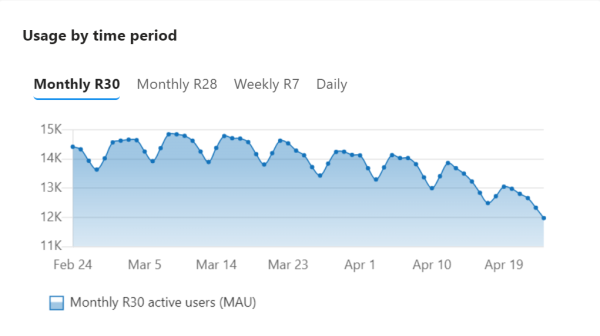
Usage by time period
The Usage by time period chart shows you the number of active users or tenants who opened and used your app across different time periods.
| Metric | Definition |
|---|---|
| Monthly R30 | Each data point represents a given R30 (Rolling 30 days) period. |
| Monthly R28 | Each data point represents a given R28 (Rolling 28 days) period. |
| Weekly R7 | Each data point represents a given R7 (Rolling 7 days) period. |
| Daily | Each data point represents a given R1 (Rolling 1 day) period. |
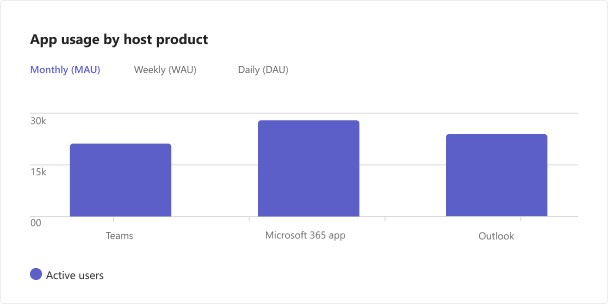
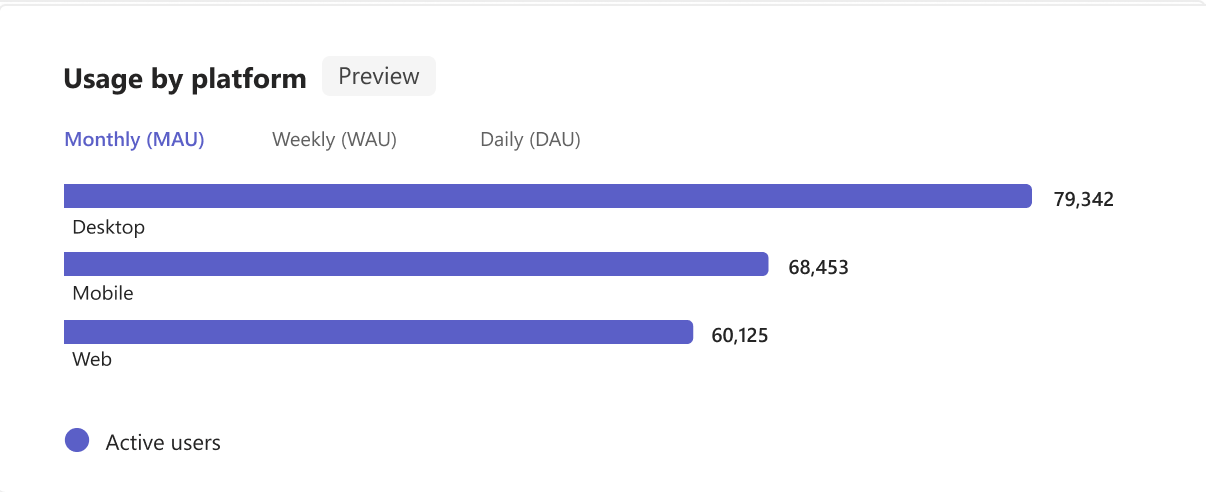
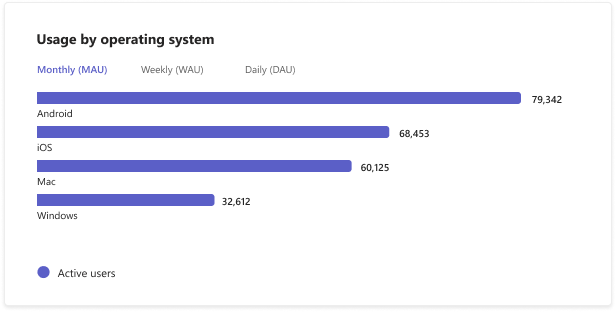
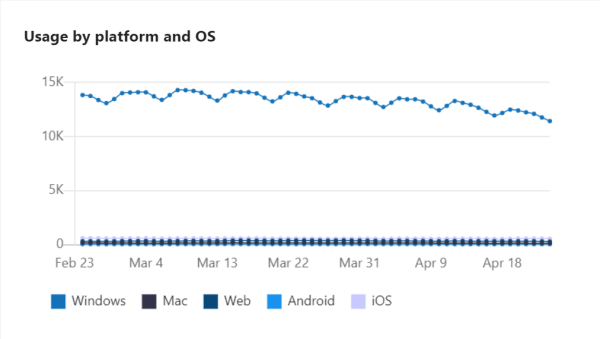
Usage by platform and OS
The Usage by platform and OS chart shows your app's active usage across various endpoints, such as Windows, Mac, iOS, Android, and Web. The same user or tenant can use an app on multiple endpoints. Each data point represents a given R30 (Rolling 30 days) period.
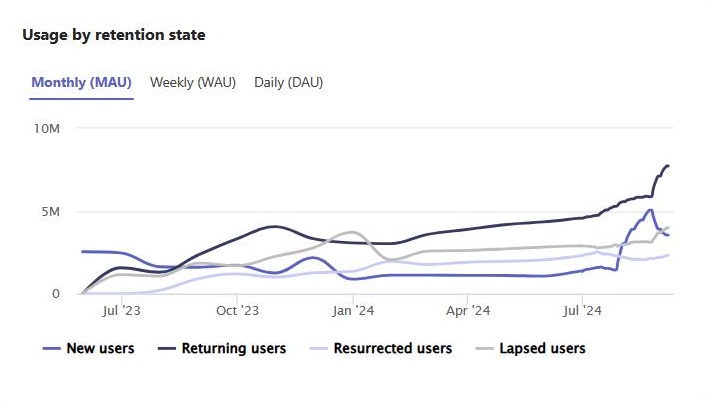
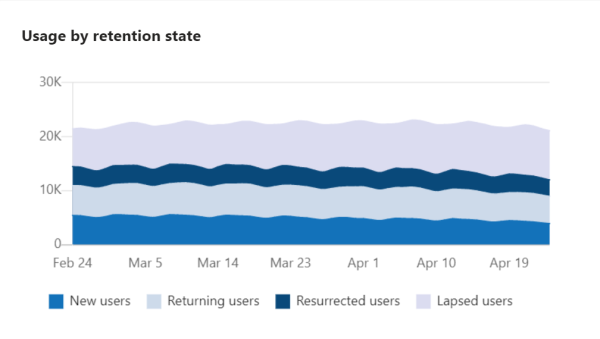
Usage by retention state
The Usage by retention state chart lets you track four key retention or churn metrics for your app over time.
| Metric | Definition |
|---|---|
| New users or tenants | Active users or tenants who are new and haven't used your app. |
| Returning users or tenants | Active users or tenants who used your app during a given R30 (Rolling 30 days) time period and the immediately preceding R30 time period. |
| Resurrected users or tenants | Active users or tenants who used your app one or more times before but not in the immediately preceding R30 time period. |
| Lapsed users or tenants | Active users or tenants who weren't seen during a given R30 time period but were seen during the immediately preceding R30 time period. |
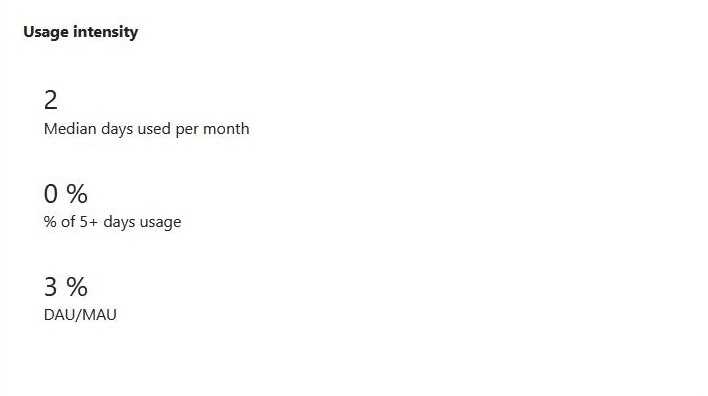
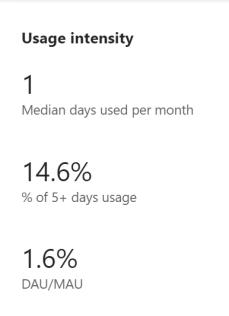
Usage intensity
The Usage intensity chart shows the key usage intensity metrics for your app.
| Metric | Definition |
|---|---|
| Median days used per month | The median number of days in which your app was opened in the last R30 (Rolling 30 days) time period. |
| % of 5+ Days usage | The percentage of active users who opened or used the app more than five days in the last R30 time period. |
| DAU/MAU | The ratio of the average number of unique users or tenants who used your app on each day divided by the Monthly active users for the selected R30 time period. |
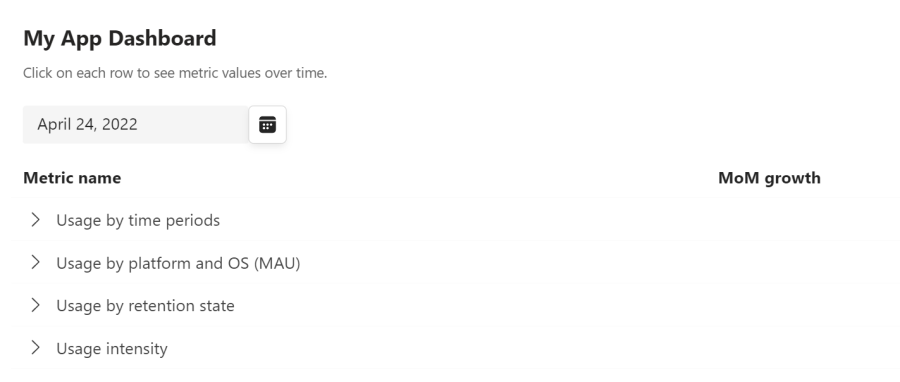
App dashboard
The My App dashboard table shows you the latest R30 (Rolling 30 days) data for each of the metrics under the previous four categories, and the Month over Month change. Use the time picker on the upper right side and select the desired date to view the following:
Daily R30 data for the last 75 days.
End of month R30 data for up to 12 months.
You can select each of these Metric name to see trends over time.