Tutorial: Use the .NET Aspire dashboard with Python apps
The .NET Aspire dashboard provides a great user experience for viewing telemetry, and is available as a standalone container image that can be used with any OpenTelemetry-enabled app. In this article, you'll learn how to:
- Start the .NET Aspire dashboard in standalone mode.
- Use the .NET Aspire dashboard with a Python app.
Prerequisites
To complete this tutorial, you need the following:
- Docker or Podman.
- You can use an alternative container runtime, but the commands in this article are for Docker.
- Python 3.9 or higher locally installed.
- A sample application.
Sample application
This tutorial can be completed using either Flask, Django, or FastAPI. A sample application in each framework is provided to help you follow along with this tutorial. Download or clone the sample application to your local workstation.
To run the application locally:
Go to the application folder:
cd msdocs-python-flask-webapp-quickstartCreate a virtual environment for the app:
py -m venv .venv .\.venv\Scripts\Activate.ps1Install the dependencies:
pip install -r requirements.txtRun the app:
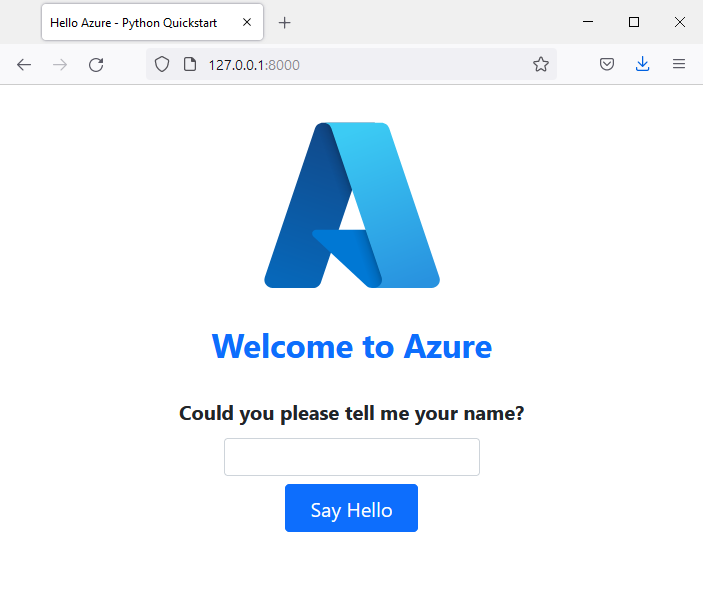
flask runBrowse to the sample application at
http://localhost:5000in a web browser.
Adding OpenTelemetry
To use the .NET Aspire dashboard with your Python app, you need to install the OpenTelemetry SDK and exporter. The OpenTelemetry SDK provides the API for instrumenting your application, and the exporter sends telemetry data to the .NET Aspire dashboard.
Install the OpenTelemetry SDK and exporter:
pip install opentelemetry-api opentelemetry-sdk opentelemetry-exporter-otlp-proto-grpcAdd a new file to your application called
otlp_tracing.pyand add the following code:import logging from opentelemetry import metrics, trace from opentelemetry._logs import set_logger_provider from opentelemetry.exporter.otlp.proto.grpc._log_exporter import ( OTLPLogExporter, ) from opentelemetry.exporter.otlp.proto.grpc.metric_exporter import OTLPMetricExporter from opentelemetry.exporter.otlp.proto.grpc.trace_exporter import OTLPSpanExporter from opentelemetry.sdk._logs import LoggerProvider, LoggingHandler from opentelemetry.sdk._logs.export import BatchLogRecordProcessor from opentelemetry.sdk.metrics import MeterProvider from opentelemetry.sdk.metrics.export import PeriodicExportingMetricReader from opentelemetry.sdk.trace import TracerProvider from opentelemetry.sdk.trace.export import BatchSpanProcessor def configure_oltp_grpc_tracing( endpoint: str = None ) -> trace.Tracer: # Configure Tracing traceProvider = TracerProvider() processor = BatchSpanProcessor(OTLPSpanExporter(endpoint=endpoint)) traceProvider.add_span_processor(processor) trace.set_tracer_provider(traceProvider) # Configure Metrics reader = PeriodicExportingMetricReader(OTLPMetricExporter(endpoint=endpoint)) meterProvider = MeterProvider(metric_readers=[reader]) metrics.set_meter_provider(meterProvider) # Configure Logging logger_provider = LoggerProvider() set_logger_provider(logger_provider) exporter = OTLPLogExporter(endpoint=endpoint) logger_provider.add_log_record_processor(BatchLogRecordProcessor(exporter)) handler = LoggingHandler(level=logging.NOTSET, logger_provider=logger_provider) handler.setFormatter(logging.Formatter("Python: %(message)s")) # Attach OTLP handler to root logger logging.getLogger().addHandler(handler) tracer = trace.get_tracer(__name__) return tracerUpdate your application (
app.pyfor Flask,main.pyfor FastAPI) to include the imports and call theconfigure_oltp_grpc_tracingfunction:import logging from otlp_tracing import configure_otel_otlp logging.basicConfig(level=logging.INFO) tracer = configure_otel_otlp() logger = logging.getLogger(__name__)Replace the
printcalls withlogger.infocalls in your application.Restart your application.
Framework Specific Instrumentation
This instrumentation has only focused on adding OpenTelemetry to our code. For more detailed instrumentation, you can use the OpenTelemetry Instrumentation packages for the specific frameworks that you are using.
Install the Flask instrumentation package:
pip install opentelemetry-instrumentation-flaskAdd the following code to your application:
from opentelemetry.instrumentation.flask import FlaskInstrumentor

# add this line after configure_otel_otlp() call
FlaskInstrumentor().instrument()
Start the Aspire dashboard
To start the Aspire dashboard in standalone mode, run the following Docker command:
docker run --rm -it -p 18888:18888 -p 4317:18889 --name aspire-dashboard \
    mcr.microsoft.com/dotnet/aspire-dashboard:9.0
In the Docker logs, the endpoint and key for the dashboard are displayed. Copy the key and navigate to http://localhost:18888 in a web browser. Enter the key to log in to the dashboard.
View Structured Logs
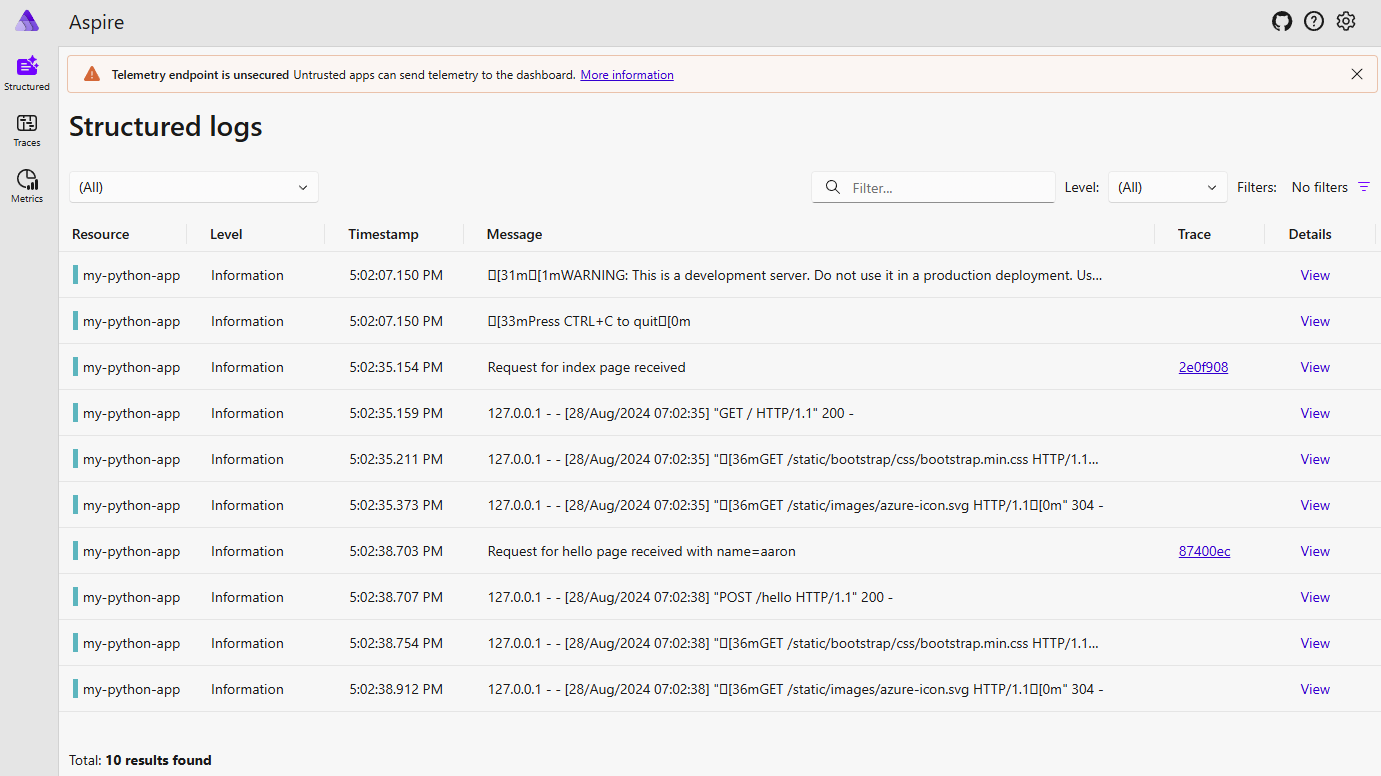
Navigate around the Python application, and you'll see structured logs in the Aspire dashboard. The structured logs page displays logs from your application, and you can filter and search the logs.

Next steps
You have successfully used the .NET Aspire dashboard with a Python application. To learn more about the .NET Aspire dashboard, see the Aspire dashboard overview and how to orchestrate a Python application with the .NET Aspire app host.

