Aggiungere un livello di estrusione poligono alla mappa in iOS SDK (anteprima)
Questo articolo illustra come usare il livello di estrusione poligono per eseguire il rendering delle aree e Polygon MultiPolygon delle geometrie delle caratteristiche come forme estruse.
Nota
ritiro di iOS SDK Mappe di Azure
Il Mappe di Azure Native SDK per iOS è ora deprecato e verrà ritirato il 3/31/25. Per evitare interruzioni del servizio, eseguire la migrazione all'SDK Web di Mappe di Azure entro il 3/31/25. Per altre informazioni, vedere La guida alla migrazione Mappe di Azure di iOS SDK per iOS.
Usare un livello di estrusione poligono
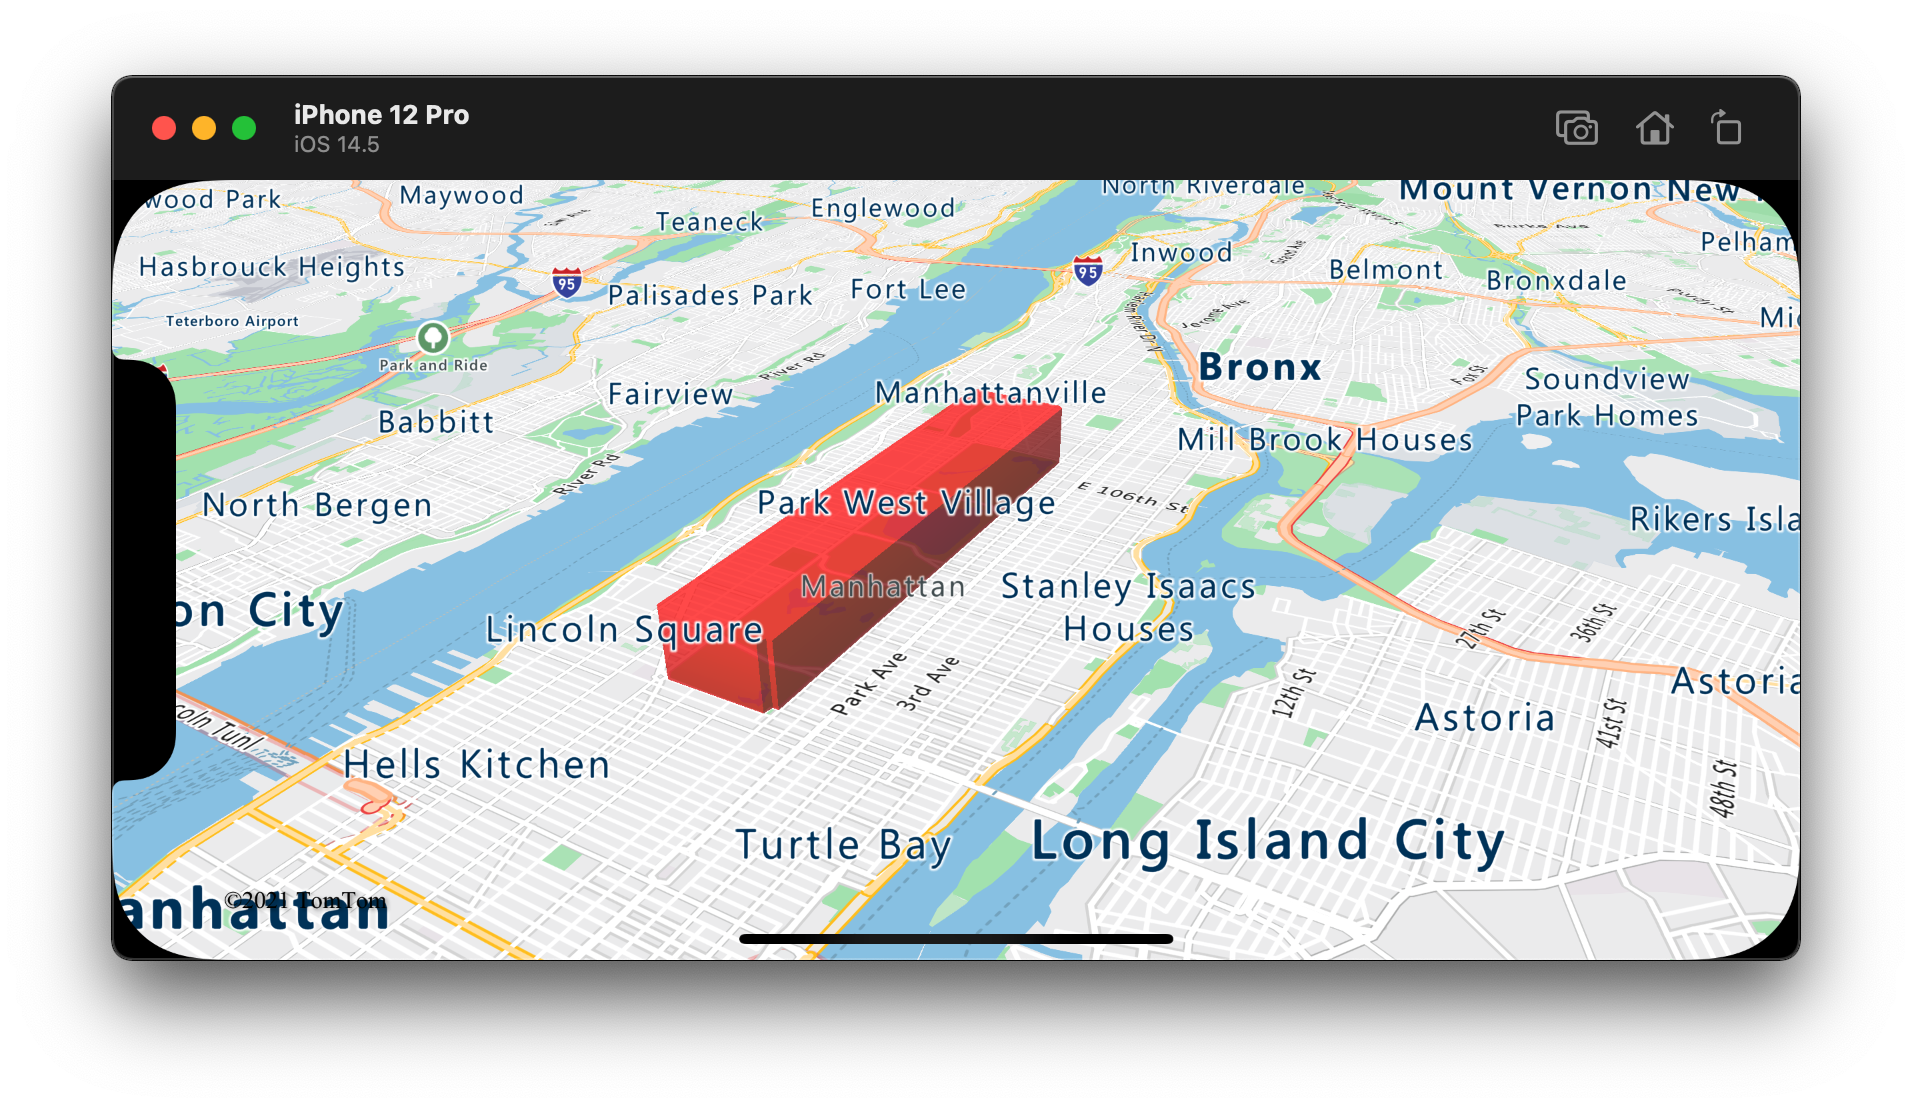
Connessione il livello di estrusione poligono a un'origine dati. Quindi, l'ha caricata sulla mappa. Il livello di estrusione poligono esegue il rendering delle aree di un Polygon oggetto e MultiPolygon come forme estruse. Le height proprietà e base del livello di estrusione poligono definiscono la distanza di base dal terreno e dall'altezza della forma estrusa in metri. Il codice seguente illustra come creare un poligono, aggiungerlo a un'origine dati ed eseguirne il rendering usando la classe del livello di estrusione Polygon.
// Create a data source and add it to the map.
let source = DataSource()
map.sources.add(source)

// Create a rectangular polygon.
source.add(geometry: Polygon([
    CLLocationCoordinate2D(latitude: 40.800279, longitude: -73.958383),
    CLLocationCoordinate2D(latitude: 40.768459, longitude: -73.981547),
    CLLocationCoordinate2D(latitude: 40.767761, longitude: -73.981246),
    CLLocationCoordinate2D(latitude: 40.764616, longitude: -73.973618),
    CLLocationCoordinate2D(latitude: 40.765128, longitude: -73.973060),
    CLLocationCoordinate2D(latitude: 40.764908, longitude: -73.972599),
    CLLocationCoordinate2D(latitude: 40.796584, longitude: -73.949446),
    CLLocationCoordinate2D(latitude: 40.797088, longitude: -73.949661),
    CLLocationCoordinate2D(latitude: 40.800523, longitude: -73.957815),
    CLLocationCoordinate2D(latitude: 40.800279, longitude: -73.958383)
]))

// Create and add a polygon extrusion layer to the map below the labels so that they are still readable.
map.layers.insertLayer(
    PolygonExtrusionLayer(source: source, options: [
        .fillColor(.red),
        .fillOpacity(0.7),
        .height(500)
    ]),
    below: "labels"
)
Lo screenshot seguente mostra il codice precedente che esegue il rendering di un poligono esteso verticalmente usando un livello di estrusione poligono.
Aggiungere poligoni basati sui dati
È possibile eseguire il rendering di una mappa choropleth usando il livello di estrusione poligono. Impostare le height proprietà e fillColor del livello di estrusione sulla misura della variabile statistica nelle geometrie delle Polygon caratteristiche e MultiPolygon . L'esempio di codice seguente mostra una mappa choropleth estrusa del Stati Uniti in base alla misurazione della densità della popolazione in base allo stato.
// Create a data source and add it to the map.
let source = DataSource()

// Import the geojson data and add it to the data source.
source.importData(fromURL: Bundle.main.url(forResource: "US_States_Population_Density", withExtension: "json")!)

map.sources.add(source)

// Create and add a polygon extrusion layer to the map below the labels so that they are still readable.
let densityColorSteps: [Int: UIColor] = [
    0: UIColor(red: 0, green: 1, blue: 0.5, alpha: 1),
    10: UIColor(red: 9 / 255, green: 224 / 255, blue: 118 / 255, alpha: 1),
    20: UIColor(red: 11 / 255, green: 191 / 255, blue: 103 / 255, alpha: 1),
    50: UIColor(red: 247 / 255, green: 227 / 255, blue: 5 / 255, alpha: 1),
    100: UIColor(red: 247 / 255, green: 199 / 255, blue: 7 / 255, alpha: 1),
    200: UIColor(red: 247 / 255, green: 130 / 255, blue: 5 / 255, alpha: 1),
    500: UIColor(red: 247 / 255, green: 94 / 255, blue: 5 / 255, alpha: 1),
    1000: UIColor(red: 247 / 255, green: 37 / 255, blue: 5 / 255, alpha: 1)
]
let colorExpression = NSExpression(
    forAZMStepping: NSExpression(forKeyPath: "density"),
    from: NSExpression(forConstantValue: UIColor(red: 0, green: 1, blue: 0.5, alpha: 1)),
    stops: NSExpression(forConstantValue: densityColorSteps)
)

let densityHeightSteps: [Int: Int] = [
    0: 100,
    1200: 960_000
]
let heightExpression = NSExpression(
    forAZMInterpolating: NSExpression(forKeyPath: "density"),
    curveType: .linear,
    parameters: nil,
    stops: NSExpression(forConstantValue: densityHeightSteps)
)

map.layers.insertLayer(
    PolygonExtrusionLayer(source: source, options: [
        .fillOpacity(0.7),
        .fillColor(from: colorExpression),
        .height(from: heightExpression)
    ]),
    below: "labels"
)
Lo screenshot seguente mostra una mappa choropleth degli Stati Uniti colorata e estesa verticalmente come poligoni estrusi in base alla densità della popolazione.

Informazioni aggiuntive
Per altri esempi di codice da aggiungere alle mappe, vedere gli articoli seguenti: