Kernel Debugging Day 2 - Interesting snippets of information for debugging in the trenches
This post continues on day 2 of a debugging adventure we started in Kernel Debugging Day 1 - Interesting snippets of information for debugging in the trenches. Today the spinning heads were still there … just spinning a lot faster, screaming for the caffeine boost regularly.
Some random, but interesting information I made a note of today

Did you know … that:
KeBugCheckEx is the kernel ejection seat, which brings down the system in a controlled manner when the kernel discovers an unrecoverable inconsistency?

PDO stands for physical device object, which us always the bottom most driver in the devstack, FDO stands for function driver object, highlighted as servicename? Any drivers above FTO are filters?
kd> !drvobj pci
Driver object (81238050) is for:
\Driver\PCI
Driver Extension List: (id , addr)Device Object list:
81264668 812659a0 81265ce8 81265030
81292438 81292780 81292ac8 81292ca8
81292020 81293030 81201490 81201680
81201870 81201a60 81201c50 81201e40
81238620
kd> !devstack 81264668
!DevObj !DrvObj !DevExt ObjectName
ffbb4038 \Driver\abcmtag ffbb40f0 Video0
81264298 \Driver\agp440 81264350
812643f8 \Driver\ACPI 8129a450 00000056
> 81264668 \Driver\PCI 81264720 ABCPNP_PCI0013
!DevNode 81264160 :
DeviceInst is "PCI\VEN_1002&DEV_4C59&SUBSYS_001A103C&REV_00\4&74c6020&0&0008"
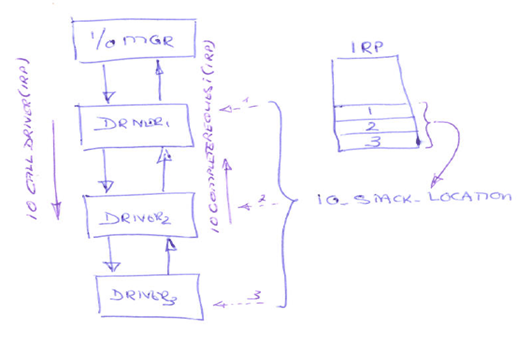
ServiceName is "abctag” IRP stands for I/O Request Packet. It is the basic I/O manager structure used to communicate with drivers and to allow drivers to communicate with each other, which involves two important functions are IoCallDriver and IoCompleteRequest, as shown in diagram.
IRQL stands for interrupt request level and defines the hardware priority at which a processor operates at any given time.
Some more Important Commands

Command |
description from WinDBG Help (go there for detailed help!) |
| !address | displays information about the memory that the target process or target computer uses. |
| !pte | displays the page table entry (PTE) and page directory entry (PDE) for the specified address. |
| .cxr | displays the context record saved at the specified address. It also sets the register context. |
| .kFrames | sets the default length of a stack trace display, i.e. 0n256 = 256 length |
More analysis of crash dumps?
----------------------------------
Instead of boring everyone with more crash dump crawl through, giving us all an opportunity to get some real sleep for a change and allowing our spinning heads to calm down for day 3, I will simply highlight a few cool things I picked up during one of the crash dump analysis.
Figuring our the arguments
Let’s assume we are starting at the following code and would like to know what data is passed to the swprintf function.
- 0: kd> kvn
- # ChildEBP RetAddr Args to Child
- 00 eb45ba8c 8046305e eb45baa4 eb369ca8 eb45bae8 nt!_woutput+0x463 (FPO: [Non-Fpo])
- 01 eb45bac4 eb369daa eb45bb08 eb369c74 eb45bd08 nt!swprintf+0x2e (FPO: [Non-Fpo])
- 02 eb45bd60 805023a8 857de298 857de288 80477abc ABCM+0x1daa
- 03 eb45bd78 804176b5 857de288 00000000 00000000 nt!SepNotifyFileSystems+0x32 (FPO: [Non-Fpo])
- 04 eb45bda8 804565fc 857de288 00000000 00000000 nt!ExpWorkerThread+0xaf (FPO: [Non-Fpo])
- 05 eb45bddc 8046b6a6 80417606 00000001 00000000 nt!PspSystemThreadStartup+0x54 (FPO: [Non-Fpo])
- 06 00000000 00000000 00000000 00000000 00000000 nt!KiThreadStartup+0x16
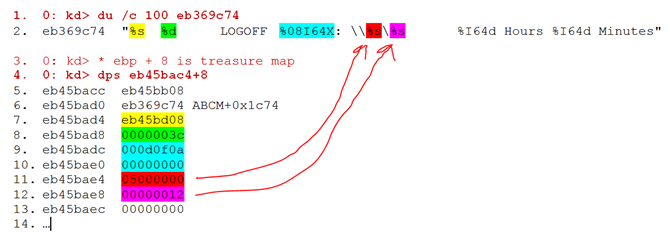
From online documentation we know that we are passing an address to a buffer, formatting information and a variable number of data arguments. To begin we display the contents of the two arguments on the stack, highlighted in the above code:
- 0: kd> du /c 100 eb45bb08
- eb45bb08 "System:8 60 LOGOFF 000D0F0A: \\蔍뮘.ᥐ薂.."
- 0: kd> du /c 100 eb369c74
- eb369c74 "%s %d LOGOFF %08I64X: \\%s\%s %I64d Hours %I64d Minutes"
Line two above, shows the data and some strange characters towards the end. The following code is colour coded, to match the format string tokens with the data. Note that the addresses in lines 11 and 12 below are suspect. Also note that the data starts at ebp + 8 on the stack … just something we should all know when we are born.
To prove this, we check the first one out a bit more:
- 0: kd> !pte 05000000
- 05000000 - PDE at C0300050 PTE at C0014000
- contains 00000000 unavailable
… that explains the crash we were looking at.
Figuring out a function internals
Let’s look at the same stack frame and figure out how we can display the complete code for the function that calls swprintf:
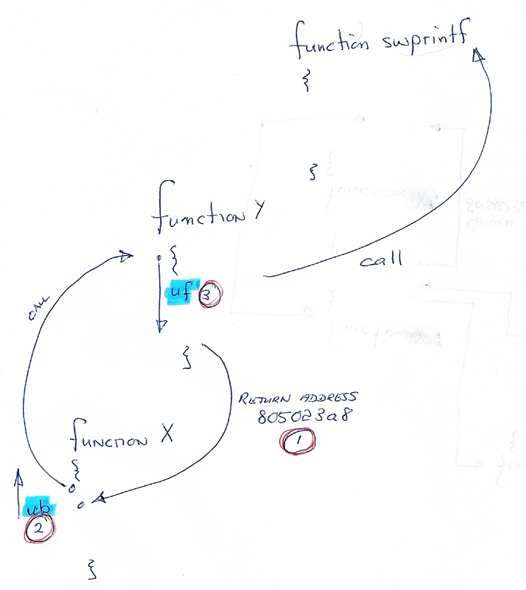
- Take the return address on line 6, which is the address to function (Y) where we will return after calling the function (X) that calls swprintf … puzzled? I was … therefore my cryptographic sketch on the right.
- Then use the ub (determines the memory range to disassemble by counting backward) command to display the calling function backwards from the point of return to find the call to function Y.
- Then use the uf (displays an assembly translation of the specified function in memory) command to display the function X and find the call to swprintf.
Let’s do it, as Zayd would say.
- 0: kd> ub 805023a8
- nt!SepNotifyFileSystems+0x19:
- 8050238f e89c3af6ff call nt!ExAcquireFastMutexUnsafe (80465e30)
- 80502394 8b3570744780 mov esi,dword ptr [nt!SeFileSystemNotifyRoutinesHead (80477470)]
- 8050239a 85f6 test esi,esi
- 8050239c 7410 je nt!SepNotifyFileSystems+0x38 (805023ae)
- 8050239e 8b4508 mov eax,dword ptr [ebp+8]
- 805023a1 8d5810 lea ebx,[eax+10h]
- 805023a4 53 push ebx
- 805023a5 ff5604 call dword ptr [esi+4]
Line 10 above is the actual call to function (X), which gives us the start address of the function. To figure out the address we need to work out where esi is set and that happens on line 4. So …
- 0: kd> dps 80477470 L1
- 80477470 e3c2d4c8
- 0: kd> dps e3c2d4c8+4 L1
- e3c2d4cc eb369ce4 ABCM+0x1ce4
On Line 1 we display the memory at the address as seen on line 4 in the previous code block and highlighted in red. We know now the value of esi, we add 4 as the statements states [esi+4] and display the memory. Line 4 gives us the starting address of function (X) on our diagram.
next we execute a uf command to list the complete function. I am only showing extracts, else you would scroll through assembler code forever:
- 0: kd> uf ABCM+0x1ce4
- ABCM+0x1ce4:
- eb369ce4 55 push ebp
- eb369ce5 8bec mov ebp,esp
- eb369ce7 81ec58020000 sub esp,258h
- eb369ced 56 push esi
- eb369cee ff7508 push dword ptr [ebp+8]
- eb369cf1 e88eeaffff call ABCM+0x784 (eb368784)
- eb369cf6 8bf0 mov esi,eax
- eb369cf8 85f6 test esi,esi
- eb369cfa 0f84d4000000 je ABCM+0x1dd4 (eb369dd4)
- ABCM+0x1d00:
- eb369d00 53 push ebx
- …cut code…
- eb369d29 8b4008 mov eax,dword ptr [eax+8]
- ABCM+0x1d2c:
- eb369d2c 3bf8 cmp edi,eax
- eb369d2e 75fc jne ABCM+0x1d2c (eb369d2c)
- ABCM+0x1d30:
- eb369d30 ff15288336eb call dword ptr [ABCM+0x328 (eb368328)]
- …cut code…
- eb369d98 8d85a8fdffff lea eax,[ebp-258h]
- eb369d9e 68749c36eb push offset ABCM+0x1c74 (eb369c74)
- eb369da3 50 push eax
- eb369da4 ff15c88236eb call dword ptr [ABCM+0x2c8 (eb3682c8)]
- eb369daa 83c430 add esp,30h
- eb369dad 8d85a8fdffff lea eax,[ebp-258h]
- eb369db3 b900b236eb mov ecx,offset ABCM+0x3200 (eb36b200)
- eb369db8 50 push eax
- eb369db9 8d45e8 lea eax,[ebp-18h]
- eb369dbc 50 push eax
- eb369dbd 8d45f0 lea eax,[ebp-10h]
- eb369dc0 50 push eax
- eb369dc1 e824070000 call ABCM+0x24ea (eb36a4ea)
- eb369dc6 50 push eax
- eb369dc7 e8d2eaffff call ABCM+0x89e (eb36889e)
- eb369dcc 56 push esi
- eb369dcd e89ee7ffff call ABCM+0x570 (eb368570)
- eb369dd2 5f pop edi
- eb369dd3 5b pop ebx
- ABCM+0x1dd4:
- eb369dd4 5e pop esi
- eb369dd5 c9 leave
- eb369dd6 c20400 ret 4
If we go back to the stack frame we know that swprintf returns to eb369daa, which means the address before is where we call swprintf. We have reverse engineered our way to the point of calling the function.
Last but not least …
May the force be with us for day 3 … I am off to sleep and to wake up in 4 hours again :| Tomorrow we shall introduce the presenter and the company delivering this exceptional course.
- .wake command causes sleep mode to end.


