OpsMgr: Sample Blue Bar State Widget Template
This blog post features a sample management pack that consist of a widget template that allows the user to create custom PowerShell Grid State Widgets with Blue Bar columns to visually identify maximum and minimum values of metrics of monitored objects, via a UI within a dashboard layout in the OpsMgr 2012 Operations Console.
This sample management pack library can now be downloaded from the TechNet Gallery.

The Blue Bar State Widget template abstracts the complexities of authoring in XML and provides the capability to create custom PowerShell-based state widgets with blue bar columns like the Sample OS Summary Dashboard. The user can insert the PowerShell script for the custom state widget via a UI in the Operations Console. Simple modifications can also be applied to the script via the template if required.
This template is defined in a management pack with a display name of Sample Blue Bar Column State Widget Template and references a custom state widget component in the Microsoft System Center Management Pack for VMM Host and VM Dashboards Visualization Components (Microsoft.SystemCenter.VMMHostVM.Visualization.Components.mpb).
Therefore, the Microsoft.SystemCenter.VMMHostVM.Visualization.Components management pack bundle (download center) must be imported before or together with the Sample Blue Bar Column State Widget Template.
Importing the management pack into a OpsMgr 2012 R2 environment will allow the widget template to appear under the "All Templates/WeiOutThere Blue Bar Column Template" folder in the "New Dashboard and Widget Wizard" page:

To create an instance of this custom Blue Bar Column state widget, first create a dashboard layout (with n-cells), Click to add widget on a cell, then select the Sample Blue Bar Column State Widget template, go through the UI pages of the template and enter the required information.
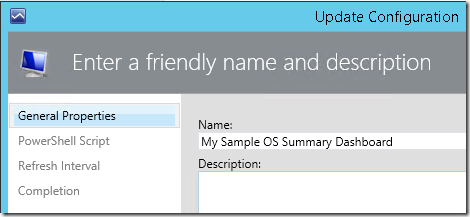
On the “General Properties” page, enter a name for the widget.
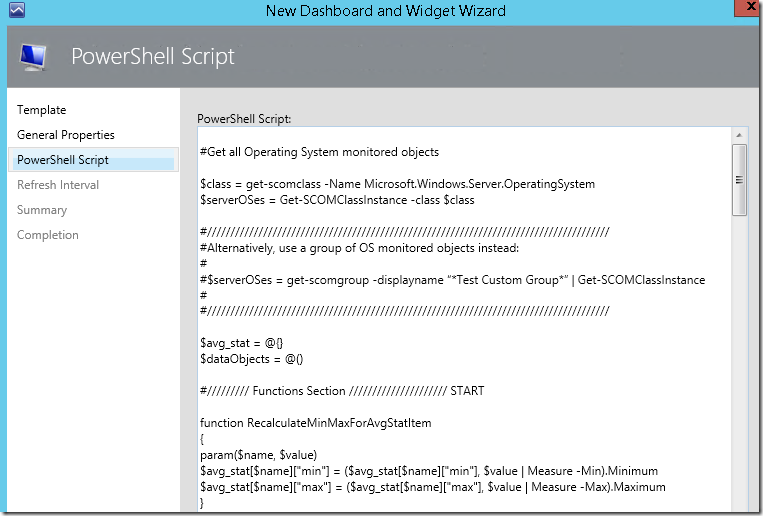
On the “PowerShell Script” page, enter the PowerShell script that runs the query and provides the data to the State Widget. The script should consist of all the key properties that utilizes the ScriptContext helper object ( $dataObject = $ScriptContext.CreateFromObject … ), to create objects to be presented on the State Widget.
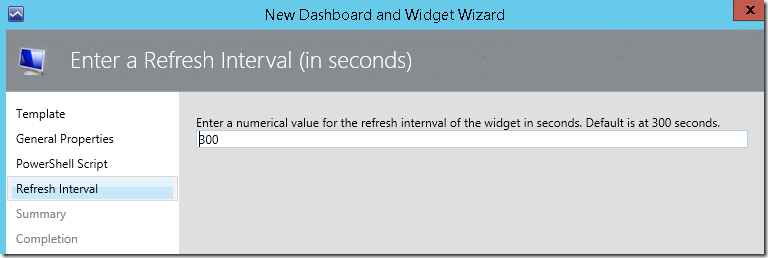
On the "Refresh Interval" page, enter a numerical value for the refresh interval of the widget (in seconds). Note that the default refresh interval for the widget is set at 300 seconds (i.e. refreshes every 5 minutes).
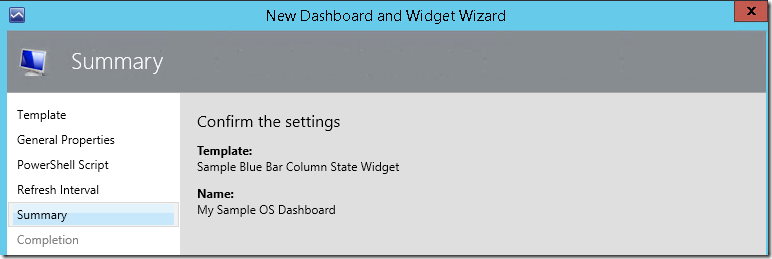
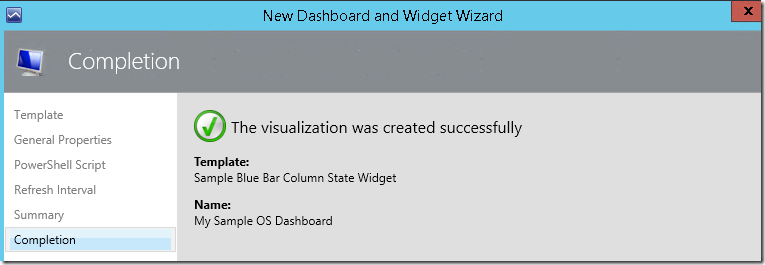
Click the Create button to create the widget.
Here is a sample script that can be used in a Blue Bar Column State Widget to retrieve and display the health state, the host name, operating system name, average performance stats for % Performance Time, Processor Queue Length and Percent Memory Used for all Windows Server OS object under the Microsoft.Windows.Server.OperatingSystem class:
#Get all Operating System monitored objects

$class = get-scomclass -Name Microsoft.Windows.Server.OperatingSystem
$serverOSes = Get-SCOMClassInstance -class $class

#//////////////////////////////////////////////////////////////////////////////////////
#Alternatively, use a group of OS monitored objects instead:
#$serverOSes = get-scomgroup -displayname "*Test Custom Group*" | Get-SCOMClassInstance
#//////////////////////////////////////////////////////////////////////////////////////

$avg_stat = @{}
$dataObjects = @()

#///////// Functions Section ///////////////////// START
function RecalculateMinMaxForAvgStatItem
{
param($name, $value)
$avg_stat[$name]["min"] = ($avg_stat[$name]["min"], $value | Measure -Min).Minimum
$avg_stat[$name]["max"] = ($avg_stat[$name]["max"], $value | Measure -Max).Maximum
}

function CreateStatistics {
param($value)
$stat = $ScriptContext.CreateInstance("xsd://Microsoft.SystemCenter.Visualization.Library!Microsoft.SystemCenter.Visualization.DataProvider/PerformanceDataStatistics")
if ($value -ne $null) {
$stat["AverageValue"] = [double]$value
$stat["Value"] = [double]$value
}
$stat
}

# Initialize Stat Item:
function InitAvgStatItem {
param($name)
if ($avg_stat[$name] -eq $null) {
$avg_stat[$name] = @{}
$avg_stat[$name]["min"] = 0
$avg_stat[$name]["max"] = [Int32]::MinValue
}
}

function AddColumnValue {
param($dataObject, $name, $value)
$v = $value
InitAvgStatItem $name
if ($v -ne $null) {
$dataObject[$name] = CreateStatistics($v)
RecalculateMinMaxForAvgStatItem $name $v
}
else
{
$dataObject[$name] = $null
}
}

#///////// Functions Section ///////////////////// END

#///////// Main Section ///////////////////// START

foreach ($serverOS in $serverOSes) {

#Create New Object
$dataObject = $ScriptContext.CreateFromObject($serverOS, "Id=Id,State=HealthState,Name=Name", $null)

$dataObject["Name"]=$serverOS.Path
$dataObject["OS"]=$serverOS.DisplayName

if ($dataObject -ne $null)  {
#Last 2 hours UTC
$aggregationInterval = 2
$dt = New-TimeSpan -hour $aggregationInterval
$nowlocal = Get-Date

#Convert local time to UTC time
$now = $nowlocal.ToUniversalTime()
$from = $now.Subtract($dt)

$perfRules = $serverOS.GetMonitoringPerformanceData()
foreach ($perfRule in $perfRules)     {

#Get % Processor Time Stat
if($perfRule.CounterName -eq "% Processor Time")   {
$data = $perfRule.GetValues($from, $now) | % { $_.SampleValue } | Measure-Object -Average
AddColumnValue $dataObject $perfRule.CounterName $data.Average
}

#Get % Memory Used Stat
if($perfRule.CounterName -eq "PercentMemoryUsed")  {
$data = $perfRule.GetValues($from, $now) | % { $_.SampleValue } | Measure-Object -Average
AddColumnValue $dataObject $perfRule.CounterName $data.Average
}

#Get Processor Queue Length Stat
if($perfRule.CounterName -eq "Processor Queue Length")  {
$data = $perfRule.GetValues($from, $now) | % { $_.SampleValue } | Measure-Object -Average
AddColumnValue $dataObject $perfRule.CounterName $data.Average
}

}
$dataObjects += $dataObject
}
}
#////////////////Main Section End //////

foreach ($dataObject in $dataObjects)
{
foreach ($metric in $avg_stat.Keys)
{
$stat = $avg_stat[$metric]
$dataObject[$metric]["MinimumValue"] = [double]$stat["min"]

if ($stat["max"] -ne [Int32]::MinValue)
{
$dataObject[$metric]["MaximumValue"] = [double]$stat["max"]
}
else
{
$dataObject[$metric]["MaximumValue"] = [double]0
}
}
$ScriptContext.ReturnCollection.Add($dataObject)
}
A special thanks to my colleague Kevin Holman for introducing the Code Formatter Plugin for Live Writer to me which allowed me to be able to put my PowerShell scripts into code inserts.
Disclaimer:
All information on this blog is provided on an as-is basis with no warranties and for informational purposes only. Use at your own risk. The opinions and views expressed in this blog are those of the author and do not necessarily state or reflect those of my employer.
Comments
- Anonymous
May 01, 2017
Nice widget!Is this widget also contextual?Regards,Chris- Anonymous
May 01, 2017
No, it works like the State Widget that other contextual widget can be based-of.
- Anonymous