Nota
L'accesso a questa pagina richiede l'autorizzazione. È possibile provare ad accedere o modificare le directory.
L'accesso a questa pagina richiede l'autorizzazione. È possibile provare a modificare le directory.
This post provides a detailed guide on how to create and configure custom performance collection rules based on standard (non-OMS bound) PowerShell Script (Performance) Rule Types, using the specific wizards. These wizards are available in a sample management pack bundle that can be downloaded from the TechNet Gallery.
For further information, refer to my earlier post on the New Sample PowerShell Collection Rule Wizards in the Ops Console.
To create a custom performance collection rule based on the standard PowerShell Script (Performance) Rule Type after importing the management pack bundle, go to the Authoring Workspace of the Operations Console first.
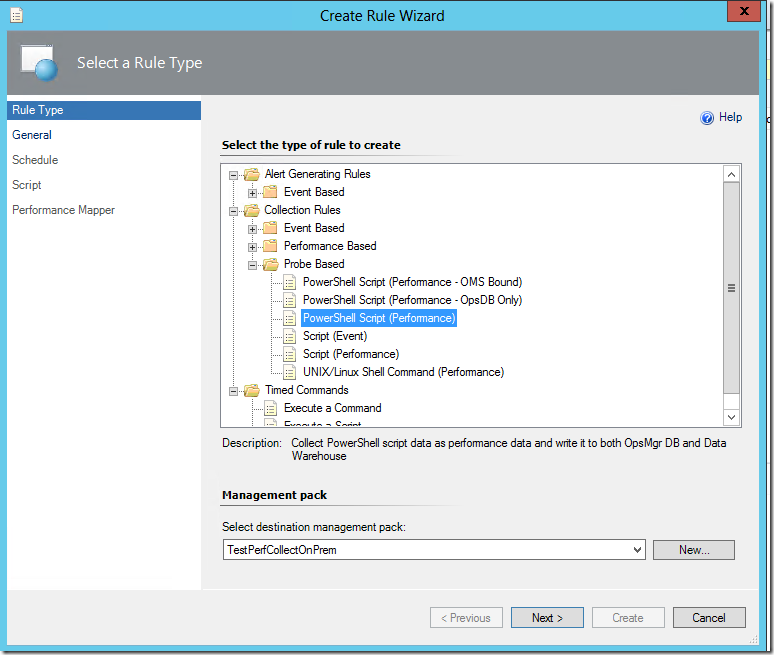
On the Rule Type page, select the PowerShell Script (Performance) rule type under the Collection Rules\Probe Based folder, and specify the management pack to save the custom rule configuration:
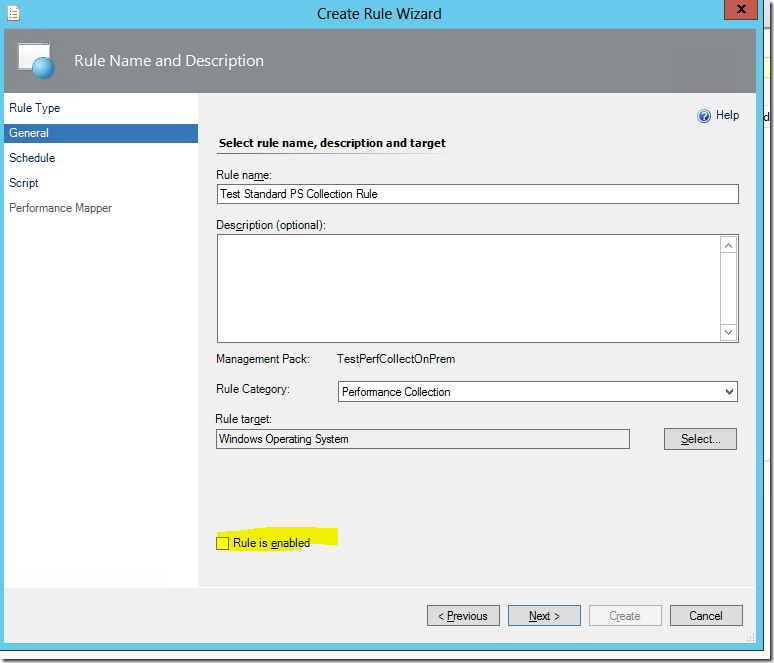
On the General Page, give the custom collection rule a meaningful name, select Performance Collection from the drop-down list, and select a target for the rule.
In this example, the Windows Operating System class is used but is disabled as this ensures that the rule does not run on all agent managed servers upon creation but can be enabled for specific servers via overrides.
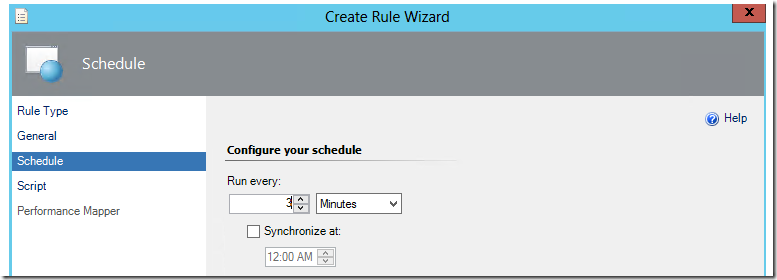
On the Schedule page, configure the sample interval for the collection rule:
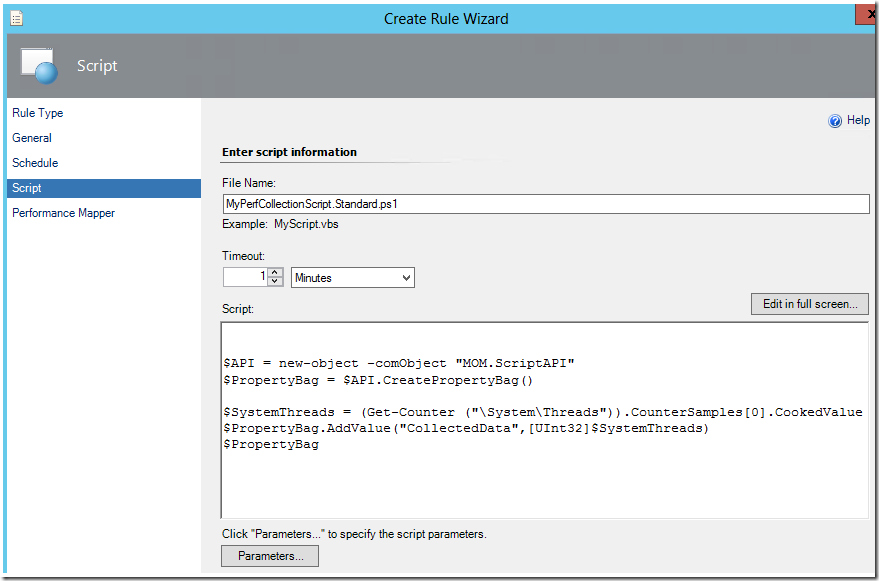
On the Script page, enter the collection script (in PowerShell) and its timeout threshold and input parameters:
The PowerShell script used in this instance returns the value of the “\System\Threads” counter to a PropertyBag that can later be referenced on the Performance Mapper page:
$API = new-object -comObject "MOM.ScriptAPI"
$PropertyBag = $API.CreatePropertyBag()
$SystemThreads = (Get-Counter ("\System\Threads")).CounterSamples[0].CookedValue
$PropertyBag.AddValue("CollectedData",[UInt32]$SystemThreads)
$PropertyBag
Refer to the following posts on how to specify Script Parameters via the Parameters option on Script page:
New Sample Wizard to Create PowerShell Monitors in the Ops Console
Using a Scriptblock in a PowerShell Monitor Created in the Ops Console
On the Performance Mapper page, the script data value collected can be retrieved from the property bag using this the right syntax:
$Data/Property[@Name=’CollectedData’]$
The ‘ellipsis’ buttons can be used to reference target variables:

Completing the last page of the wizard and clicking the Create button will create a rule based on the standard PowerShell Script (Performance) Rule Type .
In this example, the target class used is the Windows Operating System class.

After enabling the custom collection rule for a specific targeted instance via an override, the performance data should show up on the performance view scoped to that instance and custom counter:
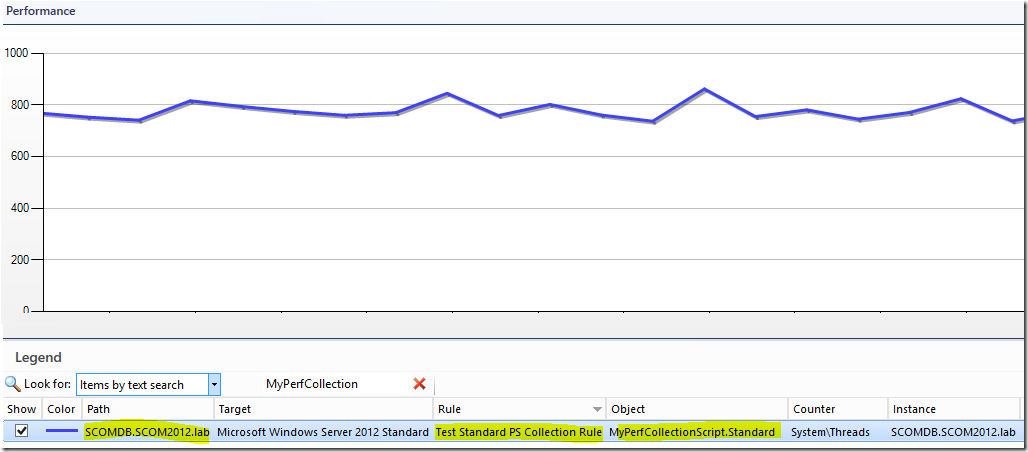
and since the collection rule writes to both OpsMgr DB and Data Warehouse DB, the performance data should show up on a Performance Widget as well:

To create a custom performance collection rule with the same configuration and collection script but only writes to the OpsMgr DB, select the PowerShell Script (Performance - OpsDB Only) rule type instead on the Rule Type page, and specify the management pack to save the custom rule configuration:

And that's it !
On the Script page, enter the same collection script (in PowerShell) and its timeout threshold and input parameters:
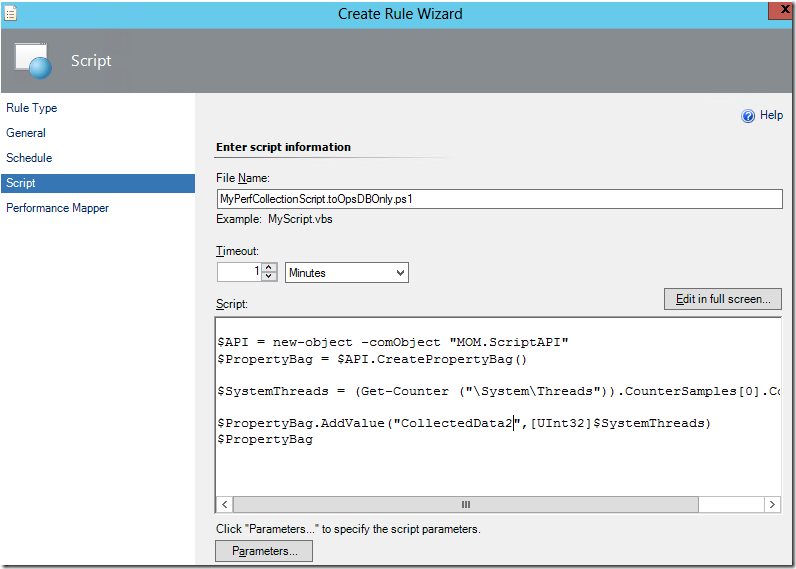
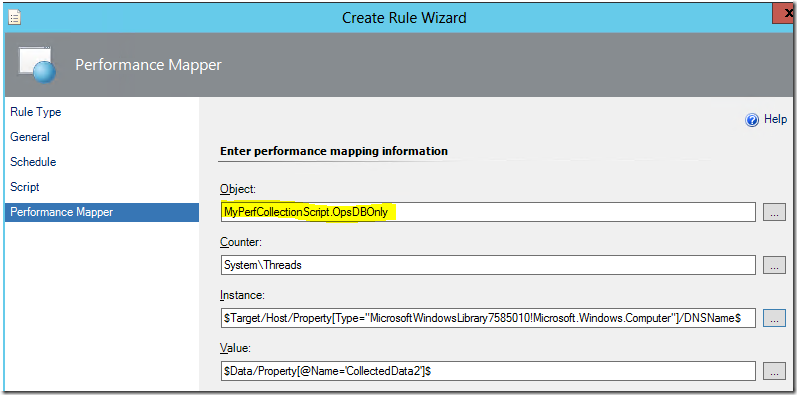
On the Performance Mapper page, the script data value collected can be retrieved from the property bag using this the right syntax:
$Data/Property[@Name=’CollectedData2’]$
Use a meaningful object name to differentiate from the object name used in the collection rule created earlier on.
After enabling the custom collection rule for a specific targeted instance via an override, the performance data should show up on the performance view scoped to that instance and custom counter:
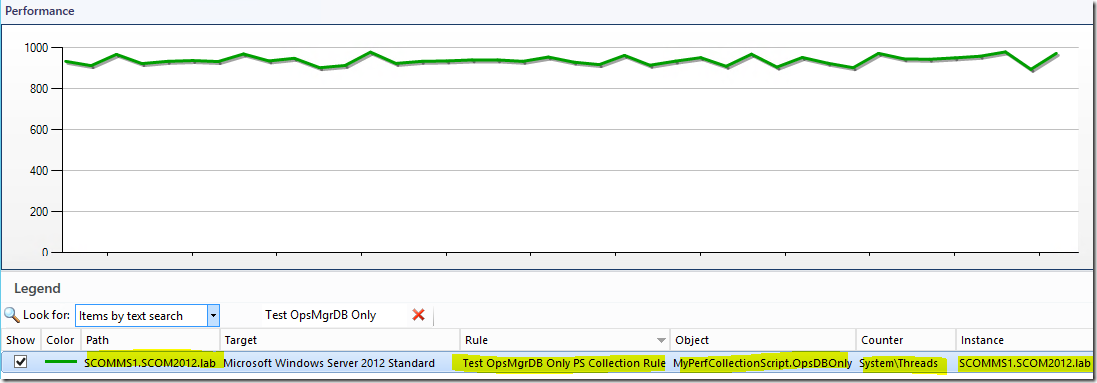
and since the collection rule ONLY writes to the OpsMgr DB and NOT the Data Warehouse DB, the performance data will not show up on a Performance Widget.