Nota
L'accesso a questa pagina richiede l'autorizzazione. È possibile provare ad accedere o modificare le directory.
L'accesso a questa pagina richiede l'autorizzazione. È possibile provare a modificare le directory.
The OMS Free Tier Data Consumption Tracker is a dashboard that extends the Log Analytics Usage records and provides a summary view of the data usage relative to the 500 MB daily data upload limit of the OMS Free Tier, calculated in percentage. It provides a clearer picture on whether the daily upload limit of the Free Tier is being stretched or close to being hit when used in an OMS Workspace and can be downloaded from the TechNet Gallery.
This post provides some additional information on how we can utilize the Free Tier Data Consumption Tracker to understand OMS data ingestion behaviour and status of a particular OMS Workspace using the Free Tier.
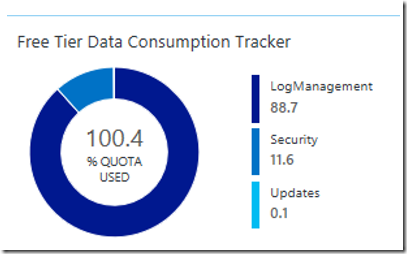
For an OMS Workspace using the Free Tier, if the daily data upload limit for the Free Tier is exceeded, data ingestion will stop (until UTC midnight when it will resume). However, this stop action does not take place immediately and it takes a little while longer for the data ingestion to fully come to a stop. Hence, some of the data collected beyond that limit will still show up in the OMS Portal.
The Free Tier Data Consumption Tracker uses a direct approach to calculate the percentage of the Free Tier data allowance used within the last 24 hours (NOW-24HOURS) regardless of whether it overlaps with UTC midnight or not. With this approach, if the data flows in to the OMS Workspace at a steady volume and the hourly data allowance used is on average safely below the hourly data limit of around 4%, then the % Quota Used value shown on the Tracker’s view will be a value that is below 100%.
When a value of over 100% is displayed on the Tracker, it could be due to the following reasons:
When large volumes of data is collected within a small time window in the last 24 hours, causing the % Quota Used to spike up to a value more than 100%, as illustrated in the table below:

On the Usage page, it could look like the following example where more than 500 MB of data was ingested into the OMS Workspace and only stops after 859 MB (171.8% of the Free Tier allowance) was ingested.

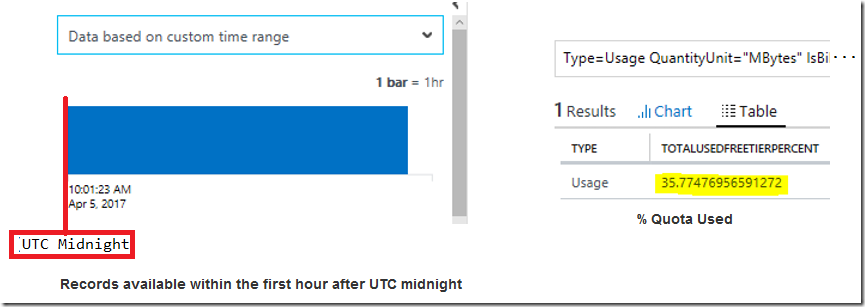
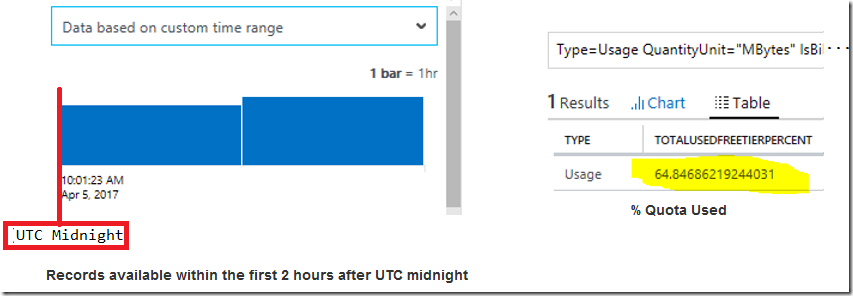
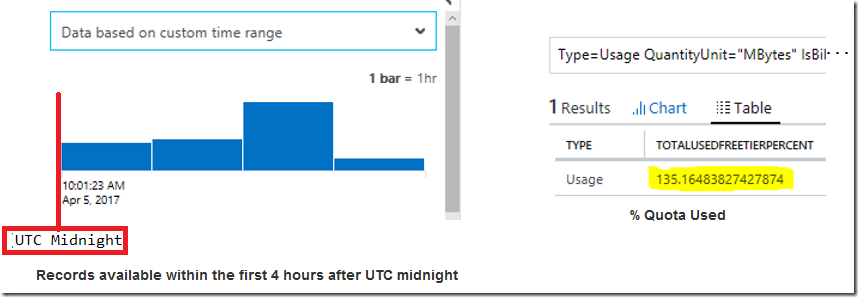
Another example below uses the time window chart on the top left of the Log Search page to show the relative size of the total number of records ingested per hour, by using the Custom setting to drill into a specific hourly window:
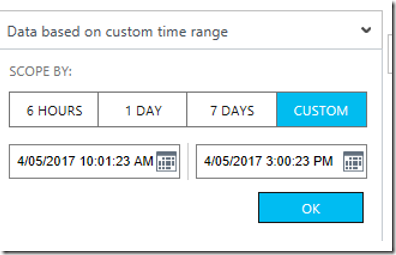
First hour after UTC midnight:
2 hours after UTC midnight:
3 hours after UTC midnight:
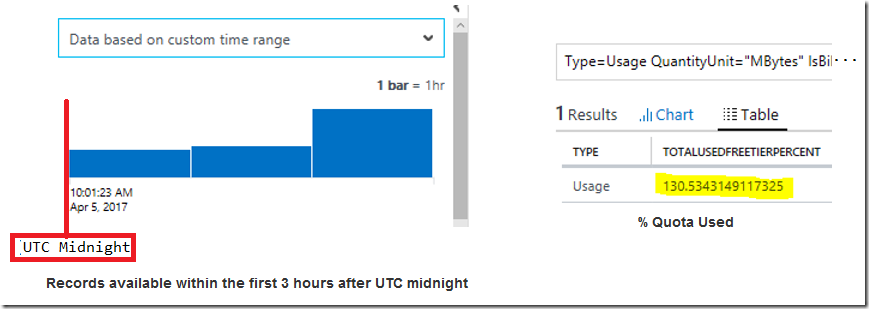
4 hours after UTC midnight:
5 hours after UTC midnight:
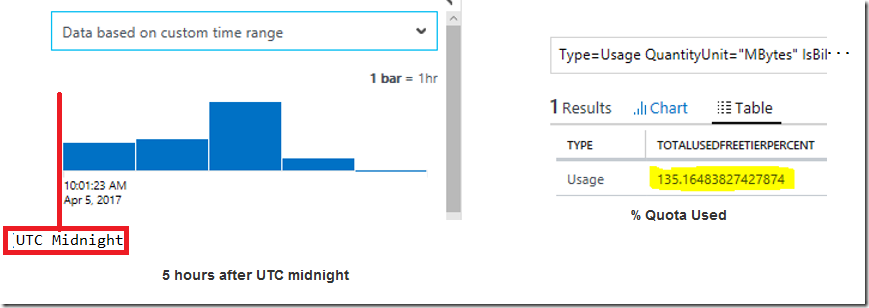
The example above shows that data ingestion for this instance stops after the 4th hour window when 135.16% of the Free Tier allowance has been consumed.
When large volumes of data is collected in the last 24 hours and overlaps with UTC midnight where the 500 MB data allowance is resumed, causing the % Quota Used to spike up to a value more than 100% or even 200%, as illustrated in the table below:

On the Tracker, it could look like the following example where more than 200% of the Free Tier allowance was consumed.
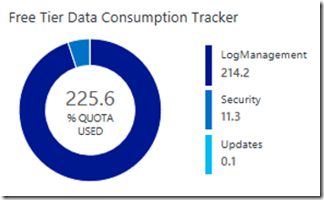

A % Quota Used value of over 100% is a good indicator that a particular OMS Workspace maybe receiving too much data due to configuration changes or something happening in the OMS monitored environment causing a sudden increase in the Or it could just be a case of the connected sources sending too much data daily to their OMS workspace via agent collection or the collector API etc and consuming all the Free Tier data allowance before reaching UTC midnight of the next day.
As demonstrated above, this “NOW-24HOURS” approach provides a straight forward summary of the overall data allowance consumption status and whether the daily upload limit of the Free Tier is being stretched or close to being exceeded to help OMS users make an educated decision on either to upgrade to the Standalone tier or to the E1/E2 subscriptions, to build on their existing investments while enjoying the larger data upload allowance or Premium solutions in the upgraded tiers.
Disclaimer:
All information on this blog is provided on an as-is basis with no warranties and for informational purposes only. Use at your own risk. The opinions and views expressed in this blog are those of the author and do not necessarily state or reflect those of my employer.