Identify log write limits on Azure SQL Managed Instance using QPI library
Azure SQL Managed Instance is fully managed SQL Server instance hosted in Azure cloud. Managed Instance introduces some limits such as max log write throughput that can slow down your workload. In this post you will see how to identify write log throughput issue on Managed Instance.
Azure SQL Managed Instance has several built-in resource limits such as max log write rate. The reason for introducing this log write limit is the necessity to ensure that log backups can catch-up incoming data.
In this post, I'm using QPI library to easily analyze wait statistics on Managed Instance. To install QPI library go to the installation section and download the SQL script for your version of SQL Server (it supports Azure SQL/SQL Server 2016+ because it depends on Query Store views).
Disclaimer: QPI library is open source library provided as-is and not maintained by Microsoft. There are not guarantees that the results are correct and that there are not bugs in calculations. This is a helper library that can help you to more easily analyze performance of your Managed Instance, but you can do the same job by looking directly at DMVs.
With this library, I can easily take a snapshot of wait statistics, wait some time and read the wait statistics values:
 exec qpi.snapshot_wait_stats;

waitfor delay '00:00:03';

select *
from qpi.wait_stats
order by wait_time_s desc;
Example of the result returned by this query is shown below:
In this example, you can see that the tasks on Managed Instance are waiting on INSTANCE_LOG_RATE_GOVERNOR wait type (with a link to the description of the wait type). You can go further and identify the queries that are causing these as it is described here: issues https://blogs.msdn.microsoft.com/sqlserverstorageengine/2019/03/05/analyzing-wait-statistics-on-managed-instance/
As an alternative, you can analyze IO performance on the Managed Instance to identify bottlenecks using the following procedure/view:
- qpi.snapshot_file_stats procedure will take a snapshot of io statistics from sys.dm_io_virtual_file_stats DM function. You MUST take the snapshot because sys.dm_io_virtual_file_stats contains cumulative information and you need to calculate sample in the recent time interval.
- qpi.file_stats view will get the file statistics since the last snapshot. This view contains several calculations such as IOPS, throughput based on a data from sys.dm_io_virtual_file_stats.
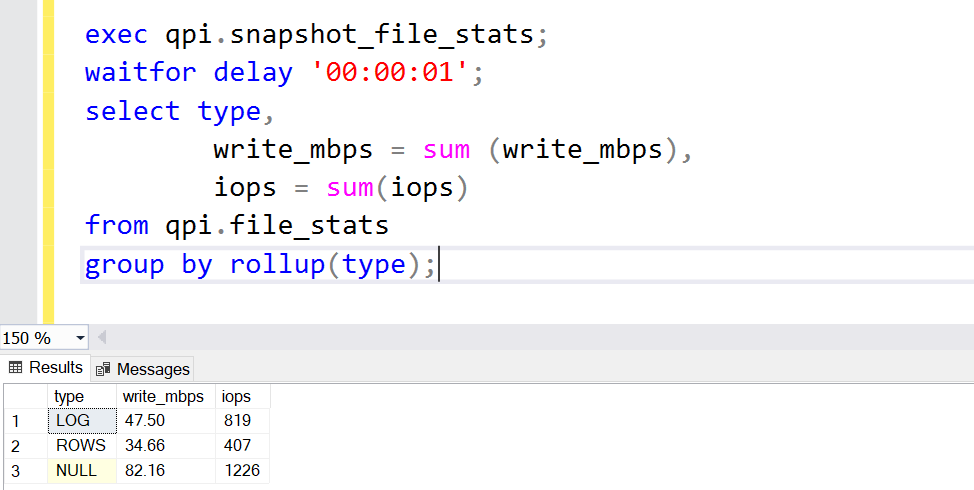
The following query will summarize write throughput (MB/s) and IOPS on the instance categorized per file types (LOG/DATA):
You can see in the result that my instance is using 47.5 MB/s writing in log file and 1226 IOPS in total. If you look at the description of resource limits in Azure documentation, you will see that ~48MB/s is log rate limit that I'm hitting and this is the reason why I see dominant INSTANCE_LOG_RATE_GOVERNOR wait statistic.
This analysis tells you that you are running some log-write heavy operation that uses most of the write log - in this case I'm running several REBUILD INDEX operations.

